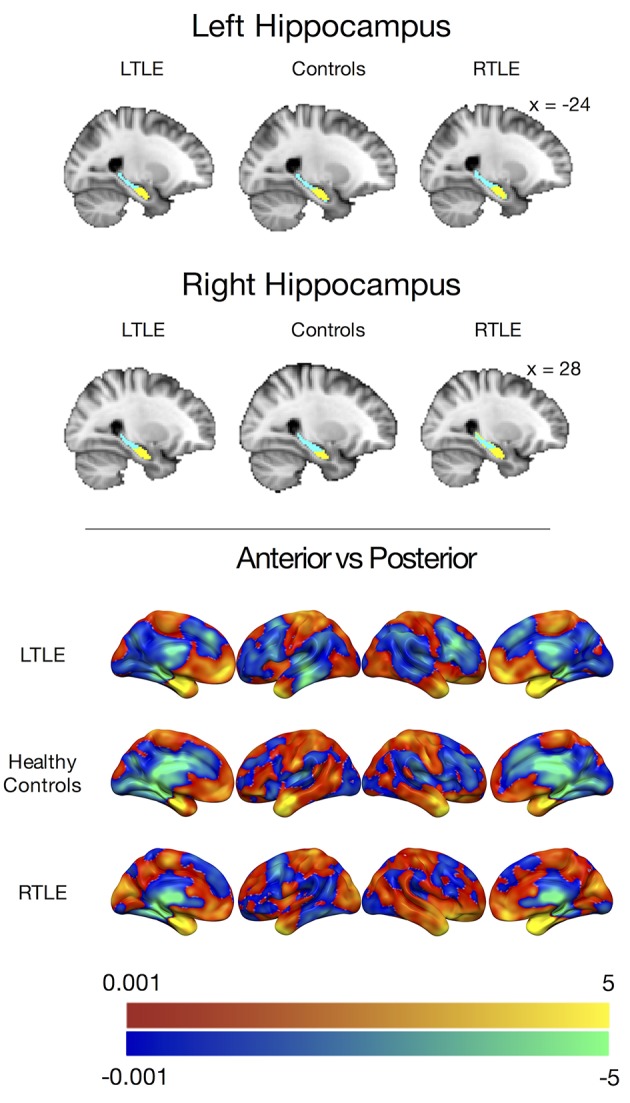
Figure 1.

(Top) Group level clusters from k-means clustering procedure, projected onto the standard MNI brain showing an anterior (yellow) and posterior (blue) cluster for both the left and right hippocampus derived from patients with left temporal lobe epilepsy, healthy controls, and patients with right temporal lobe epilepsy. (Bottom) Anterior hippocampal connectivity contrasted against posterior hippocampal connectivity in people with left temporal lobe epilepsy (LTLE), healthy controls, and people with right temporal lobe epilepsy (RTLE) presented without statistical thresholding. Warm colors indicate anterior > posterior hippocampal connectivity, while cool colors indicate posterior > anterior hippocampal connectivity. The color bars depict t-values.
