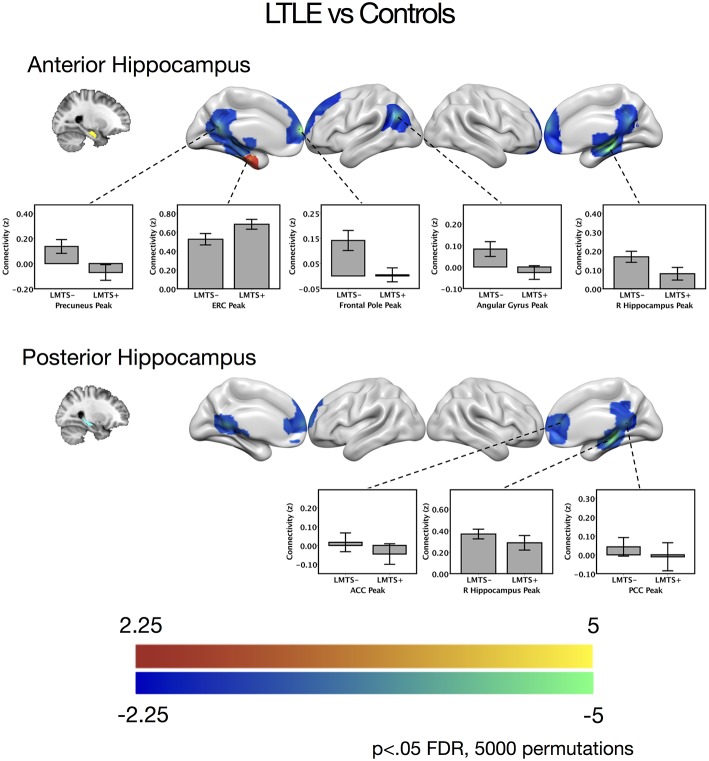
Figure 2.
Contrast maps of differences in connectivity between patients with left temporal lobe epilepsy compared to controls, seeding from either the anterior hippocampal seeds (top) or the posterior hippocampal seeds (bottom), thresholded at p < 0.05 FDR cluster correction, using 5,000 permutations. Areas of increased connectivity in LTLE, depicted in red, were only significant using a small volume correction in the entorhinal cortex. Areas of reduced connectivity in LTLE compared to controls are shown in cool colors. Bar plots depict mean group connectivity and standard error at voxels of peak difference between the LTLE group and controls, with the LTLE group separated into those with mesial temporal sclerosis (LMTS+), and those without (LMTS−). These peaks are presented below in Table 2. The color bars depict t-values. ACC, anterior cingulate cortex; ERC, entorhinal cortex; PCC, posterior cingulate cortex; R, right.

