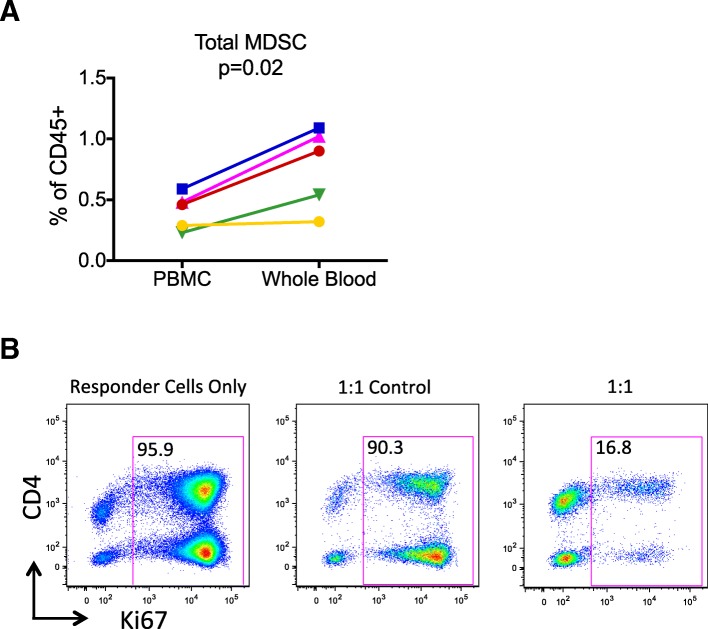
Fig. 2.
MDSC numbers in whole blood compared to PBMC, and immunosuppressive function. Total MDSC were measured using the same antibody panel in parallel using WB and PBMC from the same subjects, 2 healthy and 3 with HCC (a). Data are shown as the total MDSC percentage among CD45+ cells after imputing the number of CD45+ granulocytes to make the PBMC results comparable to the WB results. A paired t test was used to obtain the p value shown. To demonstrate suppressive activity of the MDSC identified by our assay, total MDSC (“suppressors”) were enriched as described in Materials and Methods, and cultured with autologous PBMC (“responders”) at a 1:1 ratio and stimulated with anti-CD3 and anti-CD28 beads for 4 days (right panel) (b). In addition, CD33−HLA-DR−CD3− cells were used as control non-suppressor cells (middle panel). CD3+ T cell proliferation was detected using intracellular Ki67 labeling for all conditions, including “responder cells only” shown in the left panel

