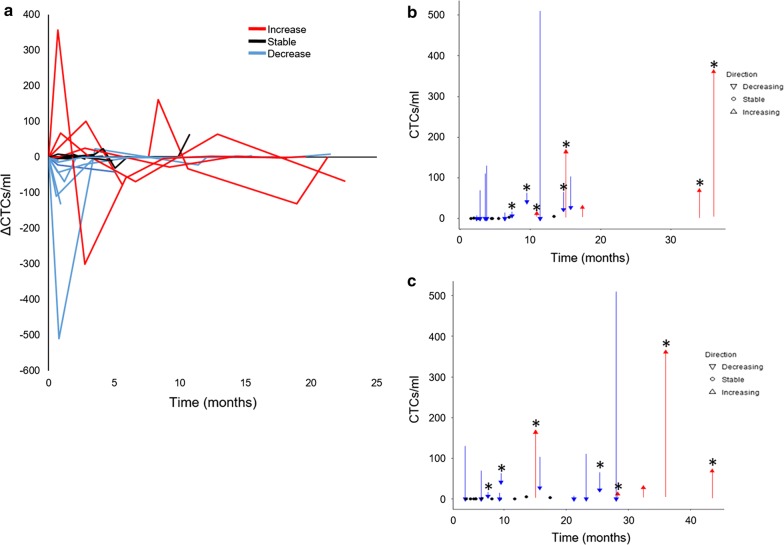
Fig. 3.
HD-CTC enumeration data for the Kinetics cohort (n = 25). a Change in HD-CTC counts in NSCLC patient samples after entering 1st line therapy. b, c HD-CTC levels before and after entering 1st line therapy where arrows show the direction and magnitude of change and circles represent patients with stable HD-CTC levels. Patients that received bevacizumab treatment are shown with an asterisk. Graphical representation of PFS (b) and OS (c) are provided. Patients with (red) increasing levels, (black) stable levels, and (blue) decreasing levels of HD-CTCs/ml

