Fig. 1.
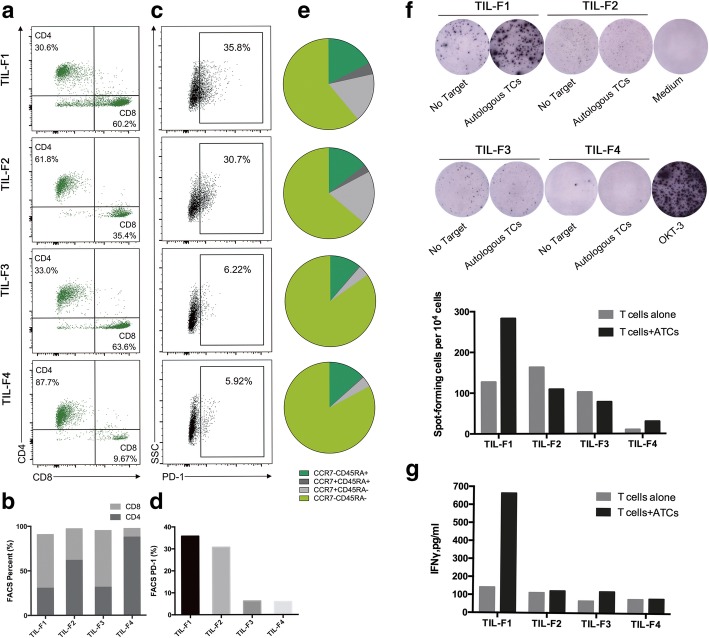
Phenotype and functional screening of different tumor infiltrating lymphocytes (TILs) fragments. a Flow cytometry analysis revealed percentages of CD4+ and CD8+ T cells from TIL-F1 to TIL-F4. b CD4/CD8 ratio. c The percentages of PD-1+T cells in four TIL fragments. d Comparision of PD-1 expression. e Comparison of memory-phenotype T cells. f IFN-γ ELISPOT analysis of all four TIL fragments cocultured with autologous tumor cells (ATCs). TILs with no targets are negative controls. Medium well is the blank negative control and OKT-3 well is the positive control. Column histogram summarized the number of positive spots. g IFN-γ ELISA measurement of all four TIL fragments cocultured with ATCs. T cells with no targets are negative controls. The results shown are representative of independent experiment done with repeated 3 times

