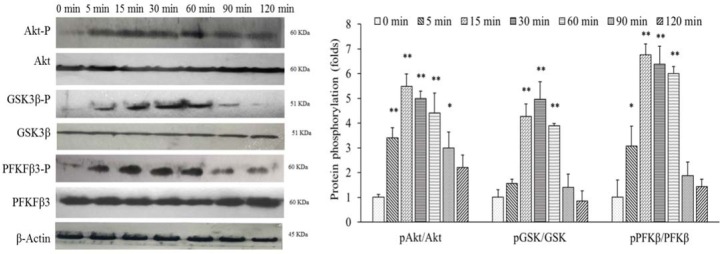
Fig. 3.
Insulin phosphorylated PFKFB3, Akt, and Gsk3β in differentiated 3T3-L1 cells at a dose dependent manner. These cells were treated with 20 nM insulin at a 0-120 min time intervals. Then, total protein was extracted and the levels of protein of interestwere determined using western blotting. These assay was repeated three times (n = 3). Bands were semiquantified using Image J software and protein phosphorylation compared with untreated groups of cells. * P < 0.05 and ** P < 0.01 indicate significant differences compared to the control (0 min). Akt, protein kinase B; GSK3, glycogen synthase kinase-3; PFK, phosphofructokinase.

