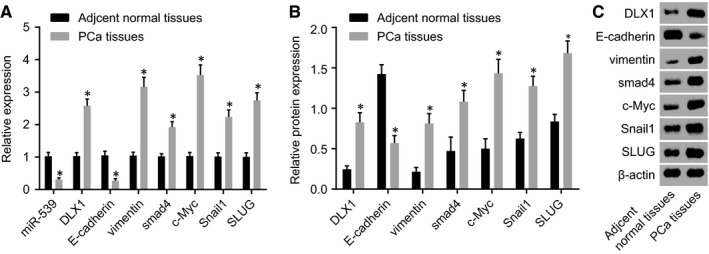
Figure 3.

PCa tissues display poor expression of miR‐539 and E‐cadherin yet high expression of DLX1, Smad4, c‐Myc, vimentin, Snail1 and SLUG. A, miR‐539 expression and mRNA expression of DLX1, Smad4, c‐Myc and vimentin, Snail1, SLUG and E‐cadherin in the PCa tissues and the adjacent normal tissues detected by RT‐qPCR; B and C, Western blot analysis of DLX1, Smad4, c‐Myc and vimentin, Snail1, SLUG and E‐cadherin proteins in the PCa tissues and the adjacent normal tissues; *P < 0.05, compared with the adjacent normal tissues; PCa, prostate cancer; miR‐539, microRNA‐539; DLX1, distal‐less homeobox 1; RT‐qPCR, reverse transcription quantitative polymerase chain reaction
