
Figure 1.
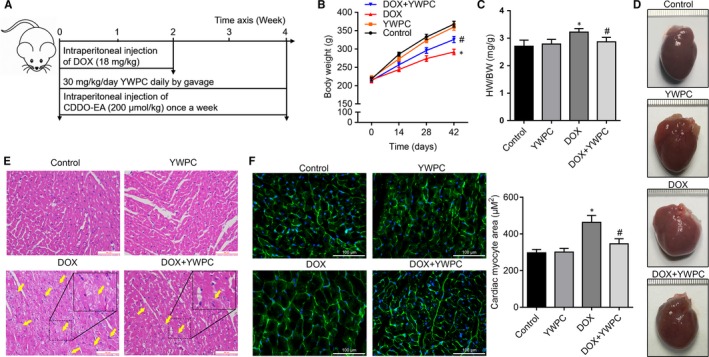
Effect of YWPC on cardiac injury and hypertrophy in rats subjected to DOX intoxication. (A) The study flow diagram for animal experiments. (B) Average body weight change in 4 wk in rats from control group, YWPC group (30 mg/kg/day), DOX groups (18 mg/kg) and DOX + YWPC group (n = 10 per group). (C) Results of heart weight/body weight (HW/BW) in the four groups at fourth week (n = 10). (D) Representative images of global appearance of the heart in different groups. (E) Representative photomicrographs of the heart tissue sections from rats treated with DOX and/or YWPC (H&E staining). The yellow arrow indicates the injured myocardial cell. Bar = 100 μm. (E) WGA staining of left ventricular tissue from rats described in A for determination of cardiac and cardiac myocyte hypertrophy (Bar = 100 μm, n = 10). *P < 0.05, vs. the control; # P < 0.05 vs. the DOX group. CDDO‐EA, CDDO ethyl amide; DOX, doxorubicin; YWPC, Yellow Wine Polyphenolic Compounds