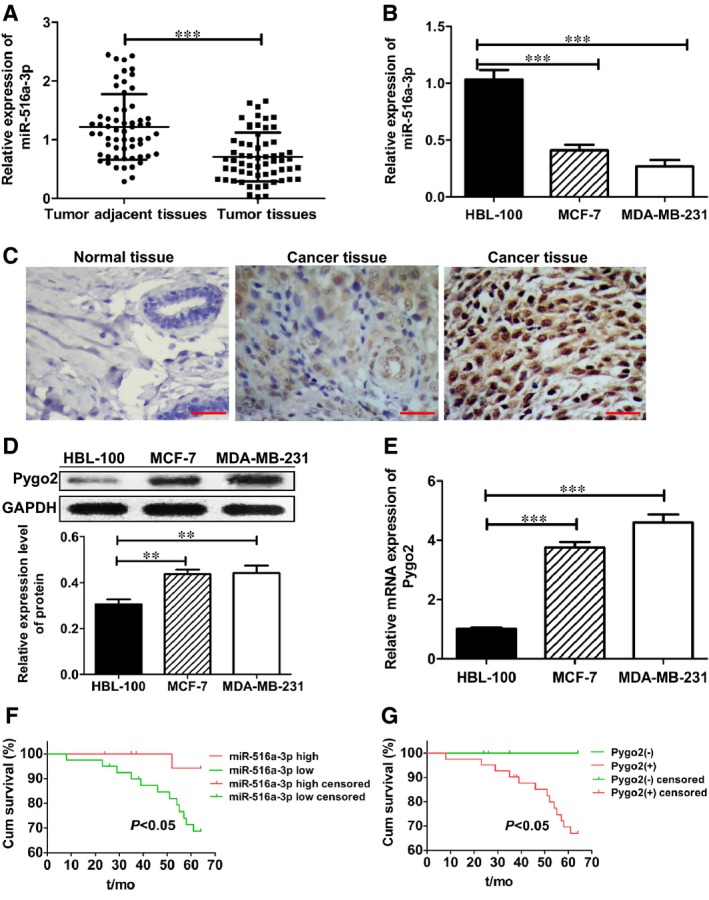
Figure 1.

miR‐516a‐3p is down‐regulated and Pygo2 is up‐regulated in breast cancer tissues and cells. A, miR‐516a‐3p expression was compared between breast cancer and paired adjacent normal breast tissues (n = 60). B, miR‐516a‐3p expression in human breast cancer cell lines (MCF‐7 and MDA‐MB‐231) and in normal human breast cell line (HBL‐100). C, Negative expression of Pygo2 protein in adjacent normal breast tissues (×400). Weak positive expression of Pygo2 protein in breast cancer tissues (×400). Strong positive expression of Pygo2 protein in breast cancer tissues (×400), bar = 50 μm, n = 60. (D‐E) The expression of Pygo2 protein and mRNA in various human breast cancer cell lines (MCF‐7 and MDA‐MB‐231) and in normal human breast cell line (HBL‐100). F, OS was compared between breast cancer patients with a high miR‐516a‐3p expression level and those with a low miR‐516a‐3p expression level. G, OS was compared between breast cancer patients with positive expression of Pygo2 protein and those with negative expression of Pygo2 protein. Data are shown as mean ± SD (**, P < 0.01; ***, P < 0.001)
