Figure 1.

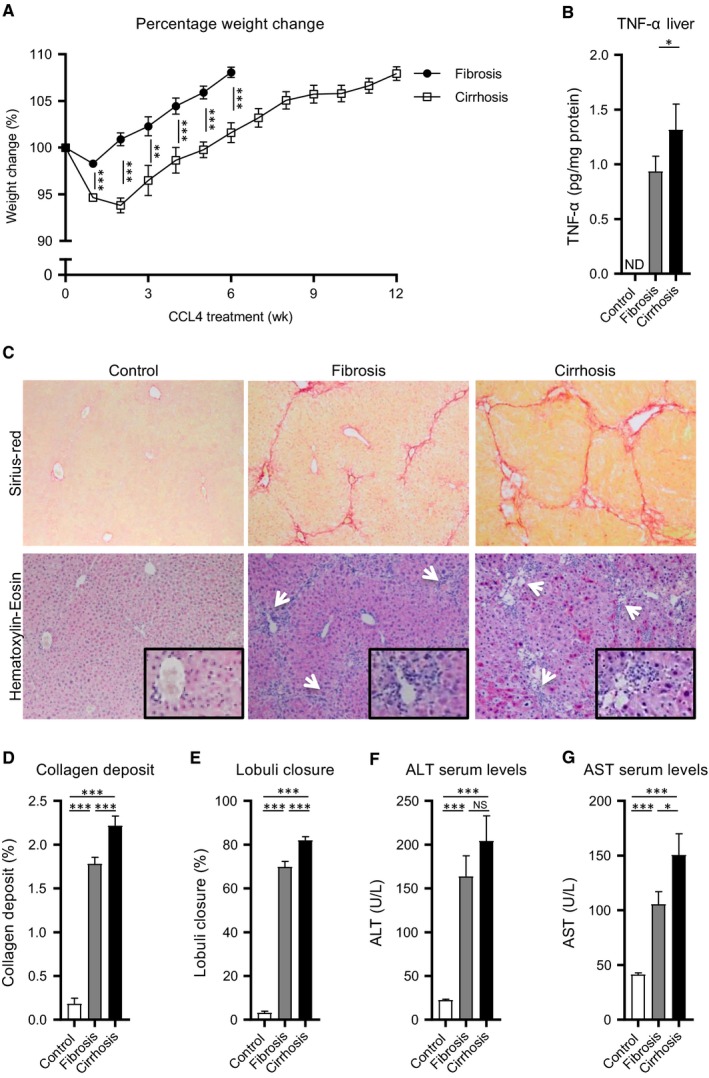
CCL4‐induced liver fibrosis and cirrhosis in mice. A, Normalized body weight during the induction of fibrosis and cirrhosis (N = 25). B, TNF‐α levels in healthy and resected liver tissues (N = 8). C, Sirius‐red and Haematoxylin‐eosin stained healthy, fibrotic and cirrhotic liver tissue (20x magnifications, inserts 40x magnifications). D, Quantified collagen deposit of Sirius‐red stained sections (N = 25). E, Estimated lobuli closure of Sirius‐red stained sections (N = 25). F and G, ALT and AST serum levels of healthy (N = 35), fibrotic (N = 30) and cirrhotic animals (N = 38). Data are expressed as mean ± SEM. *P ≤ 0.05, **P ≤ 0.01, ***P ≤ 0.001. ALT, alanine aminotransferase; AST, aspartate aminotransferase; CCL4, carbon tetrachloride; ND, not detectable; NS, not significant
