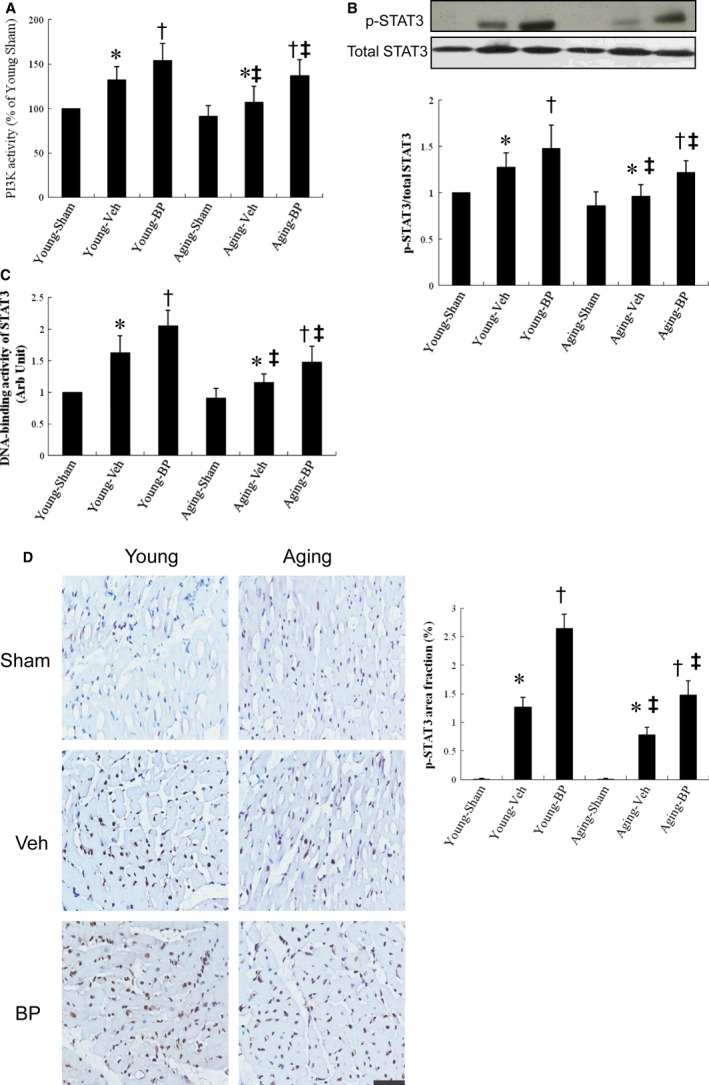
Figure 1.

PI3K activity and STAT 3 activity analysis from the border zone at day 3 after MI. A, PI3K activity. The PI3K activity was shown as fold changes to that of the vehicle. Each experiment was repeated for three times in duplicates. B, Western analysis of STAT3. Relative abundance was obtained by normalizing the protein density against that of β‐actin. Each column and bar represents mean ± SD. Each point is an average of 3 separate experiments. C, DNA‐binding activity of STAT3 was measured by ELISA with heart homogenates. D, Representative immunostaining micrographs show p‐STAT3 nuclear translocation (brown) and quantitative analysis. The value is expressed as the ratio of p‐STAT3‐stained area to total area. n‐butylidenephthalide increases the nuclear translocation of STAT3 in infarcted hearts. n = 5 in each group. Bar = 50 μm. BP, n‐butylidenephthalide. *P < 0.05 vs sham in respective age group; † P < 0.05 vs vehicle in respective age group; ‡ P < 0.05 vs the same treatment in the young group
