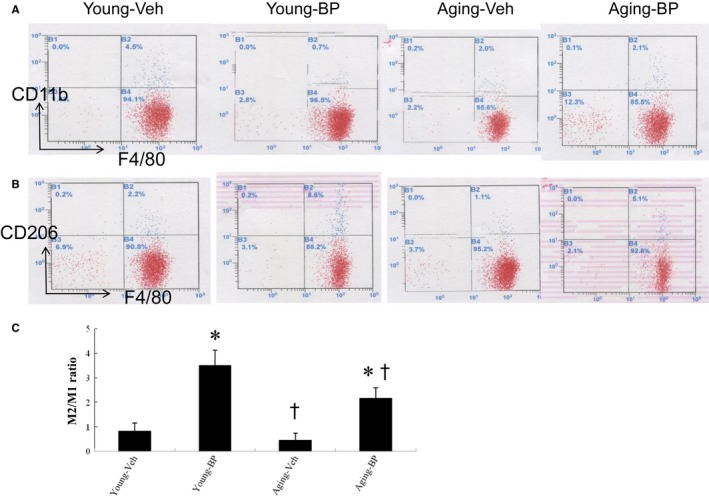
Figure 3.

Flow cytometry analyses of macrophages at the border zone at day 3 after MI. There was macrophage accumulation at the border zone. Ageing and n‐butylidenephthalide (BP) induced phenotypic switch in macrophage polarization. BP significantly reduced the M1 percentage and increased the M2 percentage, resulting in increased the M2/M1 ratio. A,B: Representative flow cytometry plots showing macrophage distribution by CD11b (A) and CD206 (B). C, The ratio of M2/M1 in the myocardium. N = 5 per group. *P < 0.05 vs vehicle in respective age group; † P < 0.05 vs the same treatment in the young group
