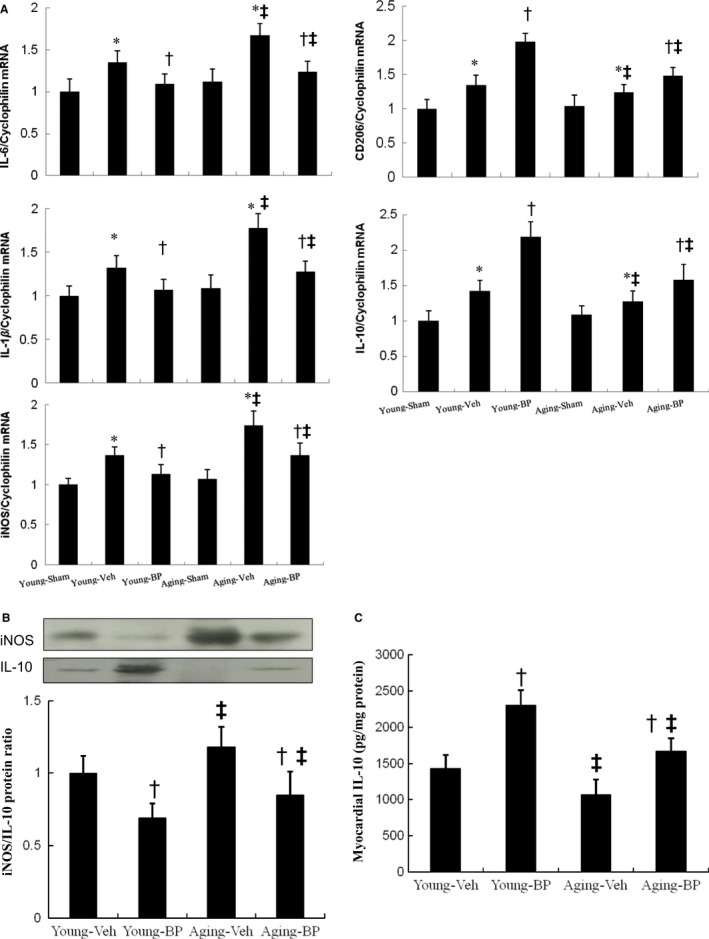
Figure 4.

Expression of gene markers and function for M1 and M2 macrophages at day 3 after MI. A, mRNA, B, iNOS and IL‐10 protein levels and C, myocardial IL‐10 activity. There is an obvious shift towards M2 macrophage phenotype in infarcted groups treated with n‐butylidenephthalide (BP) as shown by changed expressions of reduced M1‐related genes (IL‐6, IL‐1β, iNOS) and iNOS protein levels and increased M2 genes (CD206, IL‐10) and IL‐10 protein levels. *P < 0.05 vs sham in respective age group; † P < 0.05 vs vehicle in respective age group; ‡ P < 0.05 vs the same treatment in the young group
