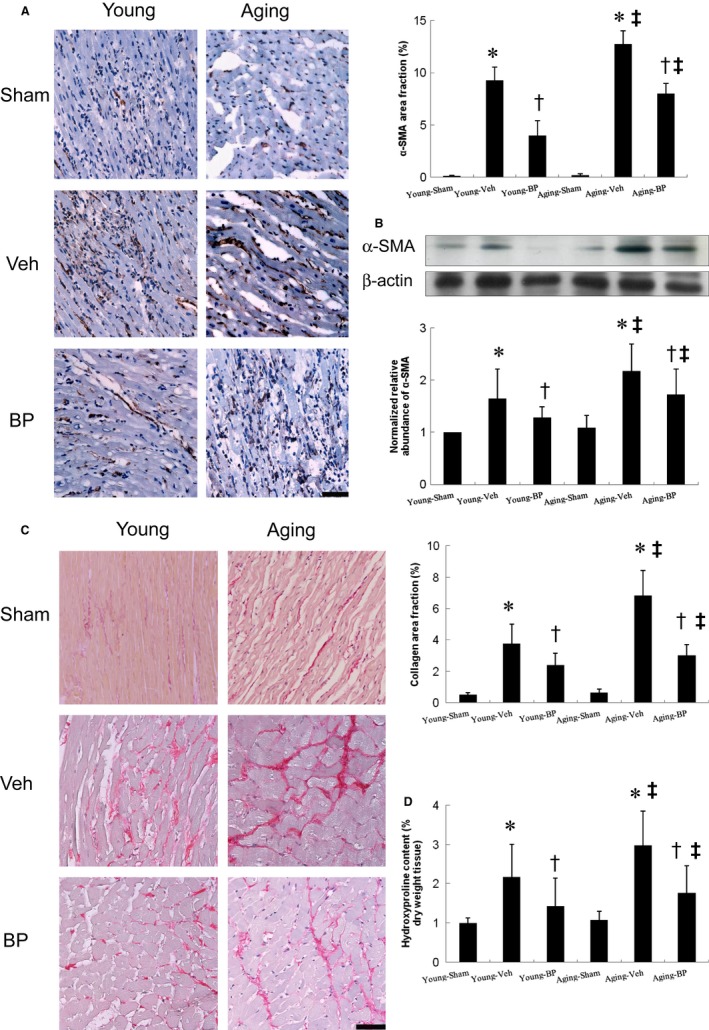
Figure 5.

Myofibroblast infiltration and cardiac fibrosis at the remote zone at day 28 after infarction. A, Representative immunohistochemical staining of α‐SMA, a hallmark of myofibroblasts (magnification 400×). B, Western blot of α‐SMA. Western blot shows consistent results of immunohistochemical staining. C, Representative sections from the remote zone with Sirius Red staining (red, magnification 400×). D, Hydroxyproline contents to measure quantitative amount of fibrosis. The line length corresponds to 50 μm. The values are mean ± SD of 5 animals from each group. *P < 0.05 vs sham in respective age group; † P < 0.05 vs vehicle in respective age group; ‡ P < 0.05 vs the same treatment in the young group
