Figure 7.

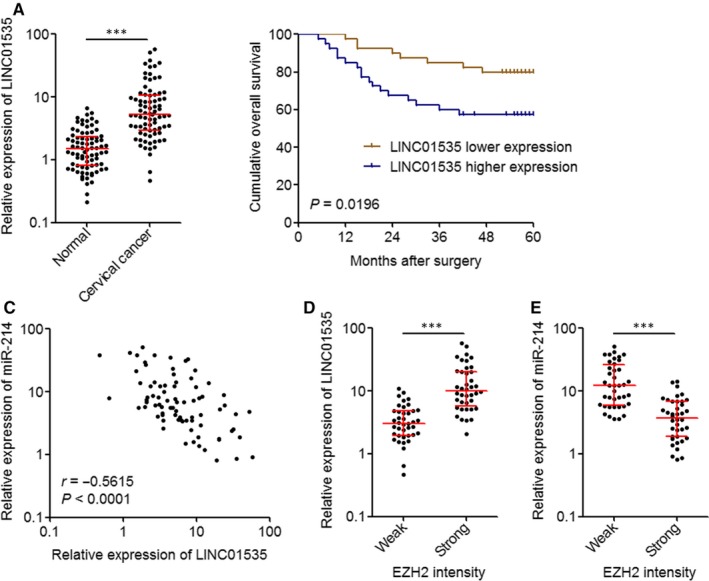
LINC01535 is up‐regulated and negatively associated with the miR‐214/EZH2 regulatory axis in cervical cancer. A, LINC01535 expression in 80 pairs of cervical cancer tissues and matched adjacent normal tissues was measured by qRT‐PCR. Results are shown as median with interquartile range. ***P < 0.0001 by Wilcoxon signed‐rank test. B, Kaplan‐Meier analysis of the correlation between LINC01535 expression level and overall survival of these 80 cervical cancer cases. The median expression level of LINC01535 was used as the cutoff. P = 0.0196 by log‐rank test. C, The correlation between LINC01535 and miR‐214 expression levels in these 80 cervical cancer tissues. r = −0.5615, P < 0.0001 by Pearson correlation analysis. D, LINC01535 expression levels in 80 cervical cancer tissues with strong or weak EZH2 staining intensity. The median EZH2 staining intensity was used as the cutoff. ***P < 0.0001 by Mann‐Whitney test. E, miR‐214 expression levels in 80 cervical cancer tissues with strong or weak EZH2 staining intensity. The median EZH2 staining intensity was used as the cutoff. ***P < 0.0001 by Mann‐Whitney test
