
Figure 1.
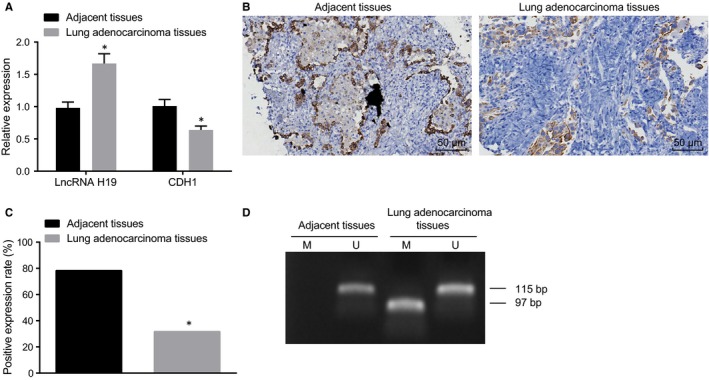
RT‐qPCR, immunohistochemistry and MSP show high expression of lncRNA H19, poor expression of CDH1 and high methylation of CDH1 in lung adenocarcinoma tissues. A, expression of lncRNA H19 and CDH1 in the lung adenocarcinoma tissues detected by RT‐qPCR; B, expression graph of CDH1 measured by immunochemistry (200×); C, statistical plot of CDH1 expression determined by immunohistochemistry; D, CDH1 methylation bands detected by MSP, M refers to amplified fragment of methylation of CDH1 (97 bp), and U refers to amplified fragment of non‐methylation of CDH1 (115 bp). RT‐qPCR, reverse‐transcription quantitative polymerase chain reaction; lncRNA H19, long non‐coding RNA H19; CDH1, E‐cadherin; MSP, methylation‐specific polymerase chain reaction. *, P < .05 vs. the adjacent tissues; the measurement data are presented as mean ± standard deviation, analysed by Student's t test. n = 60. The experiment was independently repeated three times