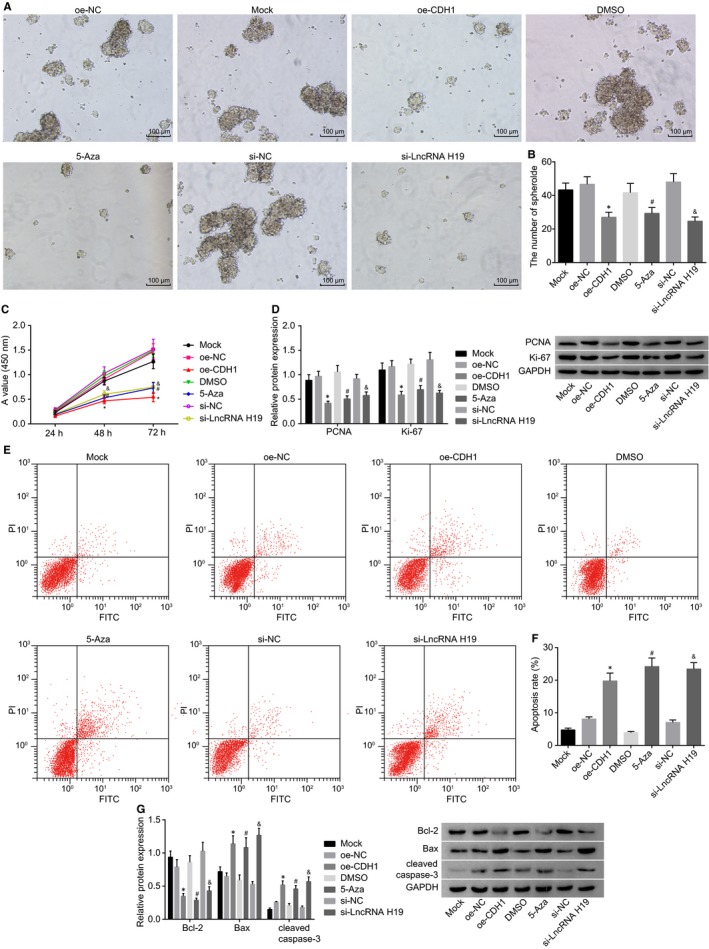
Figure 4.

Sphere‐forming assay, CCK‐8 assay and flow cytometry demonstrate that silencing of lncRNA H19, overexpression of CDH1 or demethylation of CDH1 inhibits sphere‐forming ability and invasion of A549 cells and promotes the apoptosis. A and B, sphere‐forming ability of A549 cells in each group after transfection detected by sphere‐forming assay; C, cell proliferation of A549 cells measured by CCK‐8 assay; D, expression of PCNA and Ki‐67 determined by Western blot analysis; E, cell apoptosis measured by flow cytometry; F, statistical plot of A549 cell apoptosis in which the upper left quadrant identifies the necrotic cells (annexin V−/PI+), the upper right quadrant identifies the late apoptotic cells (annexin V+/PI+), the lower left quadrant identifies the live cells (annexin V‐/PI‐), and the lower right quadrant identifies the early apoptotic cells (annexin V+/PI‐); G, expression of Bax, Bcl‐2 and cleaved caspase‐3 determined by Western blot analysis. lncRNA H19, long non‐coding RNA H19; CDH1, E‐cadherin; CCK‐8, cell counting kit‐8; PI, propidium iodide; PCNA, proliferating cell nuclear antigen; Bcl‐2, B‐cell lymphoma/lewkmia‐2; Bax, Bcl‐2‐associated X protein; NC, negative control; DMSO, dimethylsulfoxide; GAPDH, glyceraldehyde‐3‐phosphate dehydrogenase. *P < .05 vs the oe‐NC group; # P < .05 vs the DMSO group; & P < .05 vs the si‐NC group. The measurement data are presented as mean ± standard deviation, analysed by one‐way analysis of variance. n = 3. The experiment was independently repeated three times
