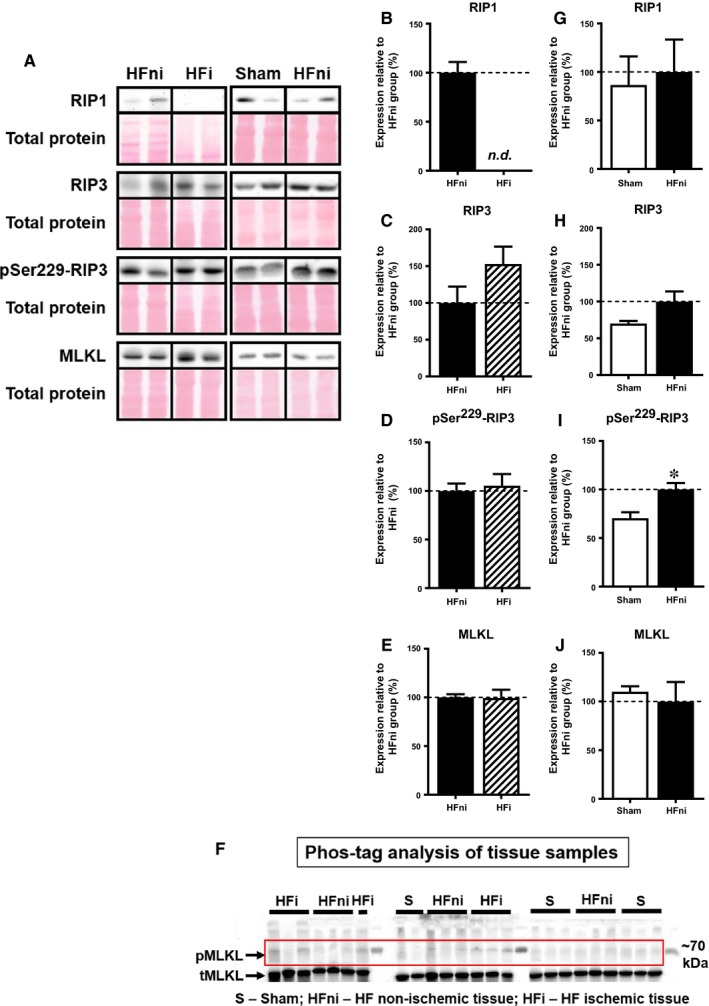
Figure 4.

Analysis of necroptotic signalling in left ventricles lysates. A, Representative immunoblots and total protein staining; B‐E, G‐J, Immunoblot quantification of RIP1, RIP3, pSer229‐RIP3 and MLKL; F, Phos‐tag™ immunoblots. Sham—sham‐operated group; HFni—non‐infarcted tissue; HFi—infarcted tissue. Data are presented as mean ± SEM; n = 5‐9 per group; *P < 0.05 vs Sham; Abbreviation: n.d., non‐detectable
