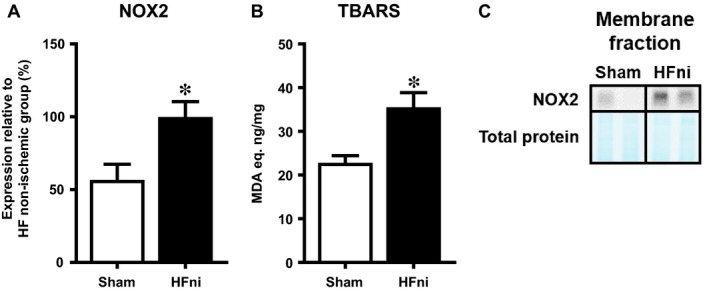
Figure 9.

Analysis of oxidative stress in membrane fraction of left ventricles. A, Quantification of NOX2; B, analysis of membrane lipids peroxidation by means of TBARS assay and C, representative immunoblot and total protein staining of NOX2 in sham‐operated group (Sham) and non‐infarcted (HFni) tissue of failing hearts. Data are presented as mean ± SEM; n = 6‐9 per group; *P < 0.05 vs Sham
