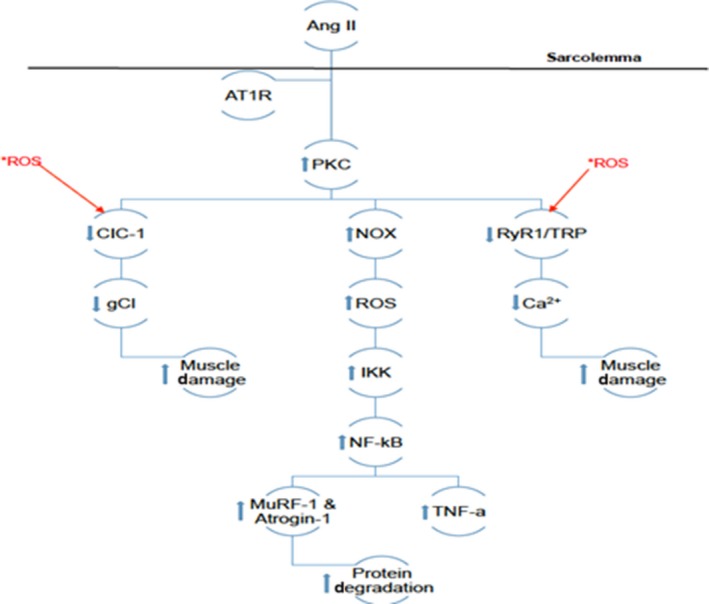
Figure 1.

Depicts the theoretical pathway of Ang‐II‐induced increase in ROS production and muscle damage. *ROS indicates the presence of intracellular ROS created by this pathway and natural pre‐existing forms. *ROS and the arrows originating from them indicate proteins intracellular ROS can interact with and illustrate the feedback loops mentioned in section 1. Other arrows illustrate the up‐regulation or down‐regulation of intracellular proteins by Ang‐II mediated by AT1R
