Figure 4.

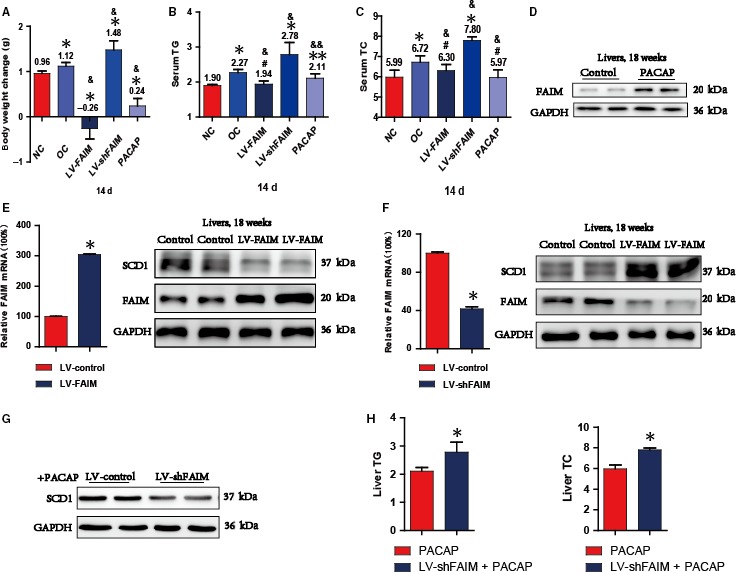
The PACAP‐FAIM pathway regulates liver metabolism and obesity A, Body weight changes of FAIM‐deficient mice (LV‐shFAIM, n = 5), FAIM‐overexpression mice (LV‐FAIM, n = 5) and mice injected with PACAP (100 nmol/L) 200 μL every other day (PACAP, n = 5) for 14 days. *P < 0.01, groups versus control groups (NC); & P < 0.01, groups versus obesity groups (OC). B and C, The serum triglyceride (TG) and total cholesterol (TC) levels were detected after lentivirus infection for 14 days. Two independent experiments, with five per group in each experiment. *P < 0.01, **P < 0.05 or #P > 0.05, groups versus control groups (NC); & P < 0.01 or &&P < 0.05, groups versus obesity groups (OC). D, The expression of FAIM was analysed in PACAP groups. E, Obese mice injected with LV‐FAIM or LV‐control were analysed for FAIM expression (left) and FAIM and SCD1 abundance (right). *P < 0.01, LV‐FAIM group versus LV‐control group. F, Obese mice injected with LV‐shFAIM or LV‐control were analysed for FAIM expression (left) and FAIM and SCD1 abundance (right). *P < 0.01, LV‐shFAIM group versus LV‐control group. G, The protein expression of SCD1 in LV‐control group cell and LV‐shFAIM group cell with treatment with 1 μmol/L PACAP. H, The TG and TC contents of each group in mouse liver tissues. *P < 0.01, PACAP group versus LV‐shFAIM + PACAP group (n = 5). Data are presented as mean ± SEM
