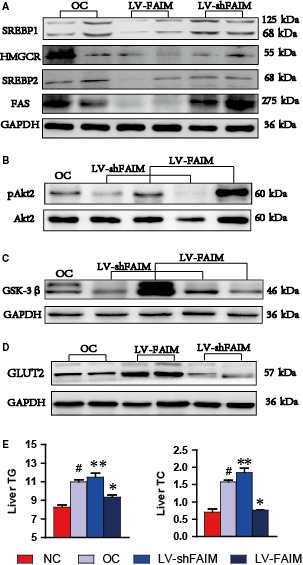
Figure 6.

FAIM‐regulated SREBP and Akt2 signalling enhance hepatic cell glucose uptake. A, Expression of SREBP 1, FAS, SREBP 2 and HMGCR in OC, LV‐shFAIM and LV‐FAIM group of liver tissues. *P < 0.01, groups versus obesity group. B, Akt2 phosphorylation and total Akt2 were analysed in the livers of obese mice after injection with LV‐FAIM or LV‐shFAIM for 14 days. C, The protein level of GSK‐3β was analysed in the livers of obese mice after injection with LV‐FAIM or LV‐shFAIM for 14 days. D, The protein level of GLUT2 was analysed in the livers of obese mice after injection with LV‐FAIM or LV‐shFAIM for 14 days. E, The TG and TC contents of each group in mouse liver tissues. #P < 0.01, obesity group versus control group; *P < 0.01 or **P < 0.05, groups versus obesity group. Data are presented as mean ± SEM
