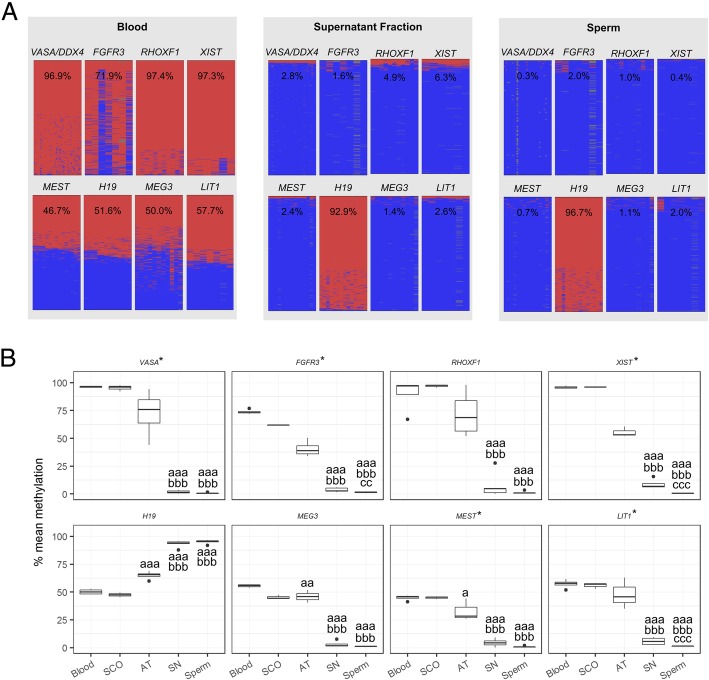
Fig. 3.
Single-allele resolution analysis of DNA methylation levels in undifferentiated germ cells (supernatant, SN) and sperm. Blood, Sertoli cell-only (SCO) samples, and testicular somatic cells (AT) are shown as somatic controls. a Exemplary DNA methylation plots for a blood sample, a supernatant fraction, and a sperm sample. Each column represents a CpG position while each line corresponds to an individual sequencing read. Methylated positions are denoted by the colour red and unmethylated by the colour blue. b Box plots displaying the DNA methylation levels for the included samples. An asterisk denotes that the methylation values were log-transformed in order to approach normality before statistical analysis (untransformed data is displayed for ease of interpretation). Statistically significant differences in average DNA methylation levels are denoted by letters: a—different from blood, b—different from AT fraction, c—different from SN fraction. p values are denoted by the number of letters, e.g. a—p < 0.05, aa—p < 0.005, aaa—p < 0.001

