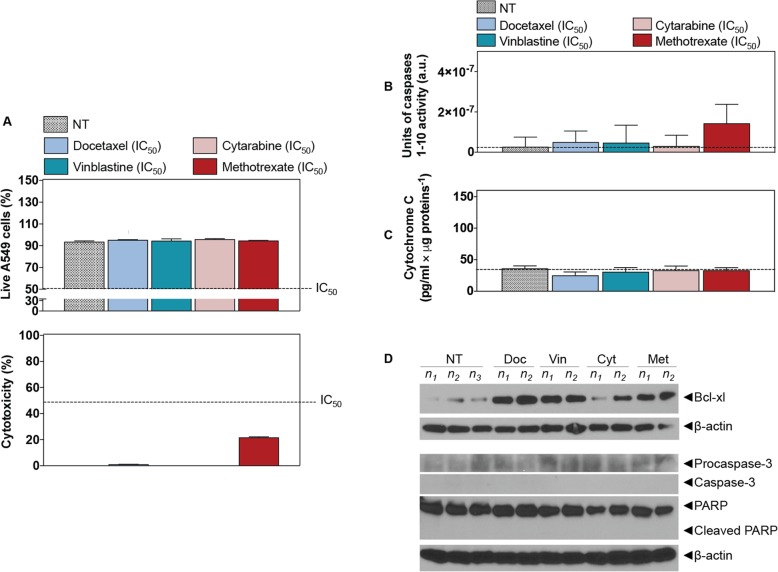
Fig. 3.
Chemoresistance evaluation in ALI multilayered co-cultures exposed to anti-cancer drugs by direct inoculation. a Percentage (%) of (from top to bottom) live A549 cells and cytotoxicity (detected by LDH cytotoxicity assay) in ALI multilayered co-cultures grown for 72 h and exposed to four different anti-cancer drugs (docetaxel, vinblastine, cytarabine and methotrexate) for 72 h. Drugs were tested at their nominal IC50 concentration. Data are reported as average ± standard error of the mean (nreplicates = 2; ntests = 3). No significant difference from the untreated cultures (NT) (one-way ANOVA with Dunnett post-test). b and c Histograms showing the b units of caspases 1–10 activity and c the levels of cytochrome c released from the mitochondria into the cell cytoplasm as detected in ALI multilayered co-cultures grown for 72 h and then exposed to four anti-cancer drugs at their nominal IC50 for 72 h. Untreated cultures were also tested as negative control (NT). Dotted lines indicate the levels of caspases activity and cytochrome c release in NT. Data are presented as average ± standard error of the mean (nreplicates = 2; ntests = 3). No significant differences from NT were found (one-way ANOVA with Dunnett post-test). d Western blot analysis of the expression of Bcl-xl, procaspase-3 and caspase-3, PARP and its cleaved form (cleaved PARP) in A549 cells forming ALI multilayered mono-cultures. Cultures were grown for 72 h and then exposed to docetaxel (Doc), vinblastine(Vin), cytarabine (Cyt) or methotrexate (Met) at their nominal IC50 for 72 h. Abbreviations “n1”, “n2” and “n3” indicate different biological replicates. β-actin expression is also reported as protein loading control

