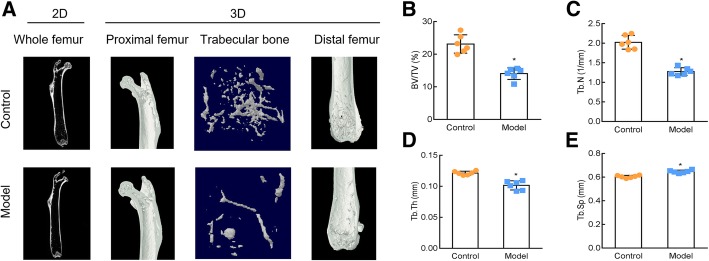
Fig. 1.
Construction of osteoporosis (OP) model induced by retinoic acid (RA). Mice were subjected to a femoral micro-CT assay of the whole femur (2D) and proximal femur, trabecular bone, and distal femur (3D) 15 d after RA administration (a). Bone volume over tissue volume (BV/TV) (b), number of trabeculae (Tb.N) (c), bone trabecular thickness (Tb.Th) (d), and trabecular separation (Tb.Sp) (e) were determined 15 d after RA administration. Control: normal mice, Model: RA-induced OP model mice. *, P < 0.05 vs control; n = 6 per group

