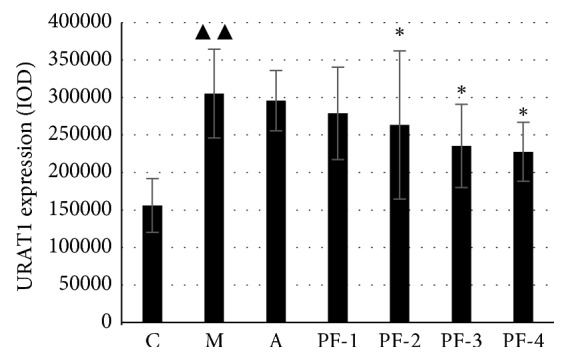
Figure 9.

URAT1 expression in kidney (IOD) of rats on the 45th day in the second stage: C control; M model; A allopurinol; PF-1, combination 1; PF-2, combination 2; PF-3, combination 3; PF-4, combination 4. ▲▲Significantly different from those of control group at the level of P < 0.01. ∗Significantly different from those of model group at the level of P < 0.05.
