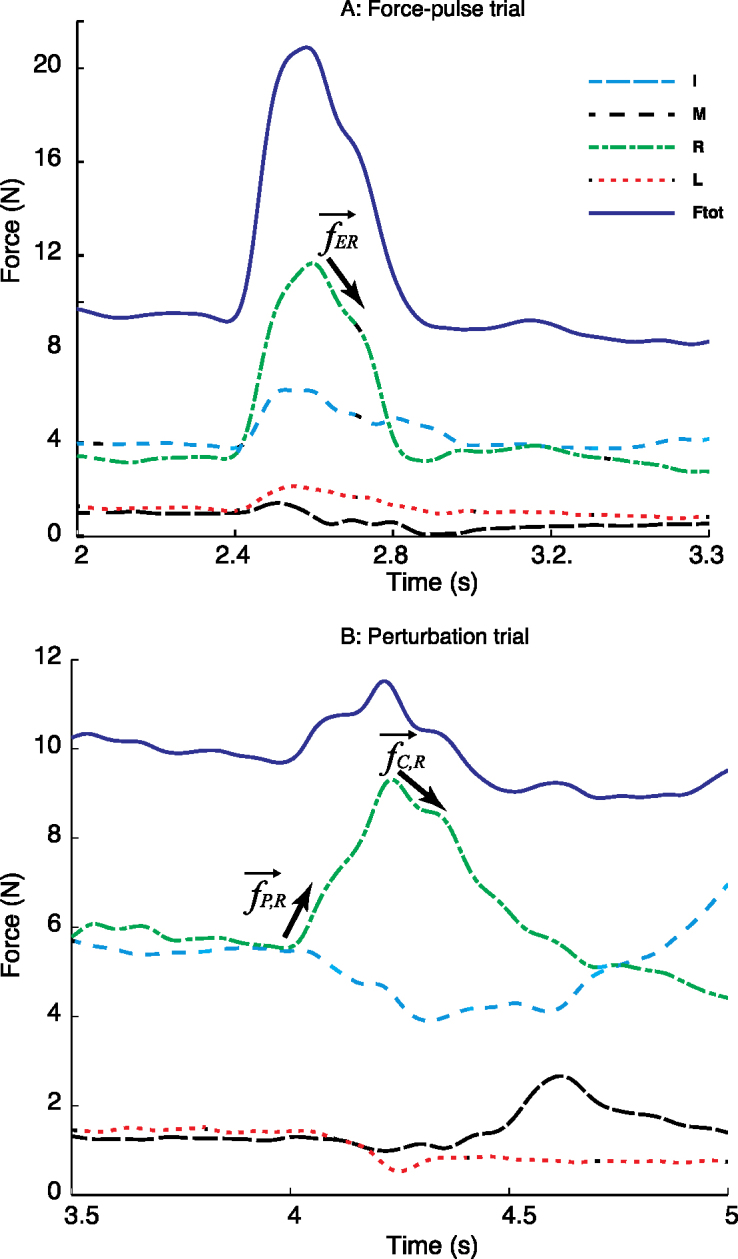
Figure 7.

Typical time profiles of the force-pulse trial (A, top panel) and perturbation trial (B, bottom panel) performed by a representative subject. The total force profile is shown with the solid trace, and individual finger forces are shown with different dashed traces. The intervals used to compute the eigenvectors in the force space are shown with the arrows.
