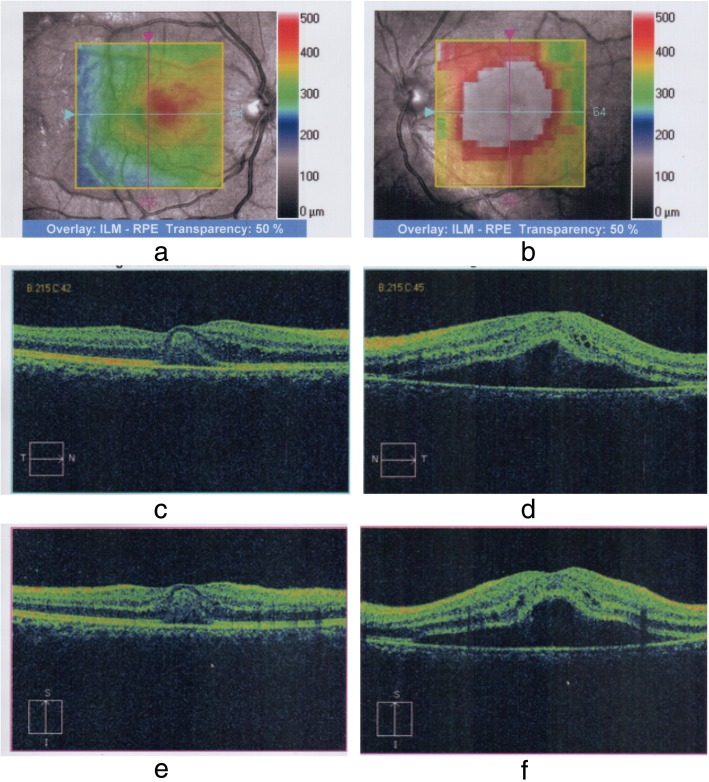
Fig. 2.
a and b Optical coherence tomography (OCT) of both eyes demonstrates retinal region involved. a Right eye. Increased thickness in the foveal region is demonstrated by the orange to pink hue. b Left eye. More marked involvement with a greater area affected is demonstrated by the pink and reddish hue centered on the fovea. Normal retinal thickness is < 320 μm within the green color spectrum, and the foveal thickness is usually 250 μm. c–f Macular scans concentrating on the region described in the OCT scans. c and d Horizontal cuts. e and f Vertical cuts. c and e Right eye. d and f Left eye. In both the horizontal (d) and vertical (f) cuts of the left eye, the foveal depression is lost and instead is elevated. The retinal pigmental epithelial layer is lifted up, but not just at the fovea. Almost the whole macula is lifted up. The gap below the RPE is dark, suggesting the presence of fluid. This is a typical appearance of “central serous choroidoretinopathy.” In the right eye, depicted in c and e, elevation (second line from the bottom) is seen at the level of the fovea with a reflective material filling the space, suggestive of foveolitis

