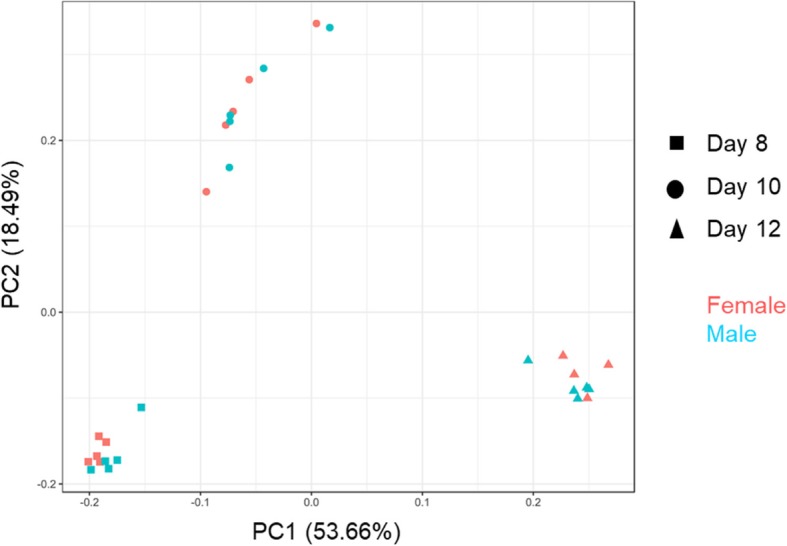
Fig. 1.

Principal component analysis of all genes expression patterns of embryos. The multidimensional scaling plot displays that embryos from the same stage are grouped together. Samples from the same stage with the same symbol (square, round, triangle shape indicate samples of Day 8, 10, and 12, respectively). Red and blue colors indicate female and male embryos, respectively
