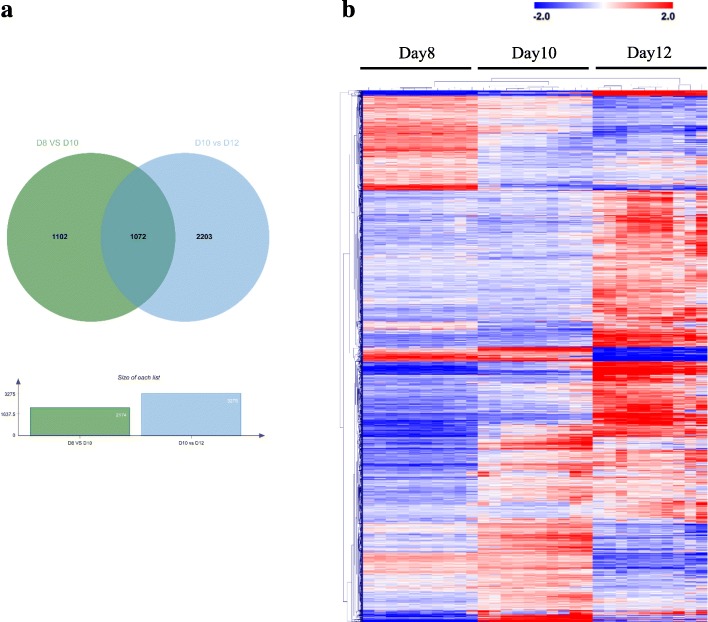
Fig. 2.
Venn diagram for differentially expressed genes identified across the three developmental stages (a). Green, Day 8 vs Day 10 of embryos; blue, Day 10 vs Day 12 of embryos. Hierarchical cluster analysis of differentially expressed genes identified for three stages (b). Mean-centered expression values (log2 counts per million of sample – mean of log2 counts per million of all samples) for the embryos of the Day 8 vs Day 10 and Day 10 vs Day 12 are shown for genes with significant differences in gene expression (FDR < 0.1% and │log2 fold change│ > 1). The color scale is from −2 (blue, lower than mean) to 2 (red, higher than mean). Each row represents 1 gene, each column 1 sample

