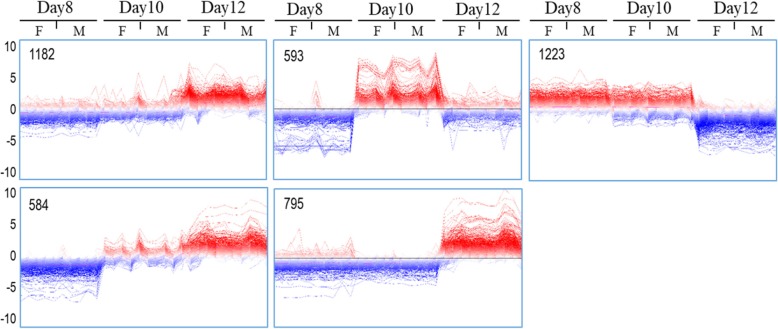
Fig. 3.
Clustering of gene expression profiles for three stages of the embryos. The SOTA of MeV software (version 4.9.0) was used to obtain groups of genes with similar expression profiles. Clusters 1 to 5 are from left to right and top to down. Vertical axis is in log2 scale and shows the deviation from the mean expression value. Numbers of genes for each cluster are shown (top left corner). F and M mean female and male embryos, respectively

