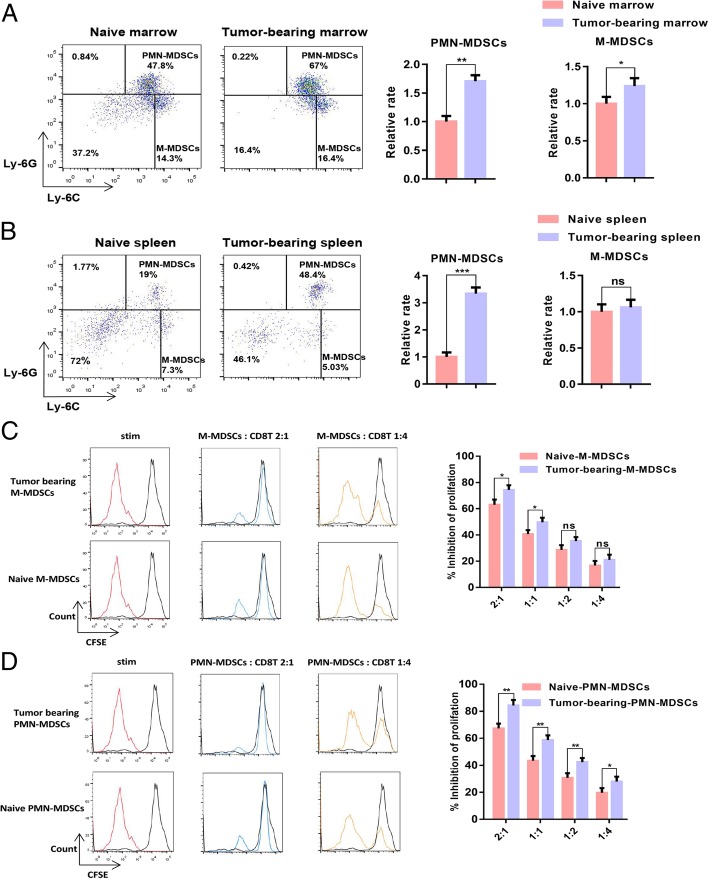
Fig. 1.
PMN-MDSCs accumulated in B16-F10 tumour-bearing mice in contrast to those in naive mice. a Dotplots of live CD11b+ cells in the bone marrow of naive or B16-F10 tumour-bearing mice (left panels) and relative proportions of PMN-MDSCs (CD11b+Ly6G+Ly6Clow) and M-MDSCs (CD11b+Ly6G−Ly6Chigh) in the bone marrow of naive and B16-F10 tumour-bearing mice (right charts). b Dotplots of live CD11b+ cells in the spleens of naive mice or B16-F10 tumour-bearing mice (left panels), and relative proportions of PMN-MDSCs (CD11b+Ly6G+Ly6Clow) and M-MDSCs (CD11b+Ly6G−Ly6Chigh) in the spleens of naive and B16-F10 tumour-bearing mice (right charts). c–d Dose-dependent suppression of CD8 T-lymphocyte proliferation by sorted bone marrow M-MDSCs and PMN-MDSCs. Representative CFSE histograms are shown (unstimulated CFSE-labelled T-lymphocytes in black). The pooled data from three independent experiments are shown. All data are represented as the mean ± SD. * p < 0.05, ** p < 0.01, ***p < 0.001, ****p < 0.0001

