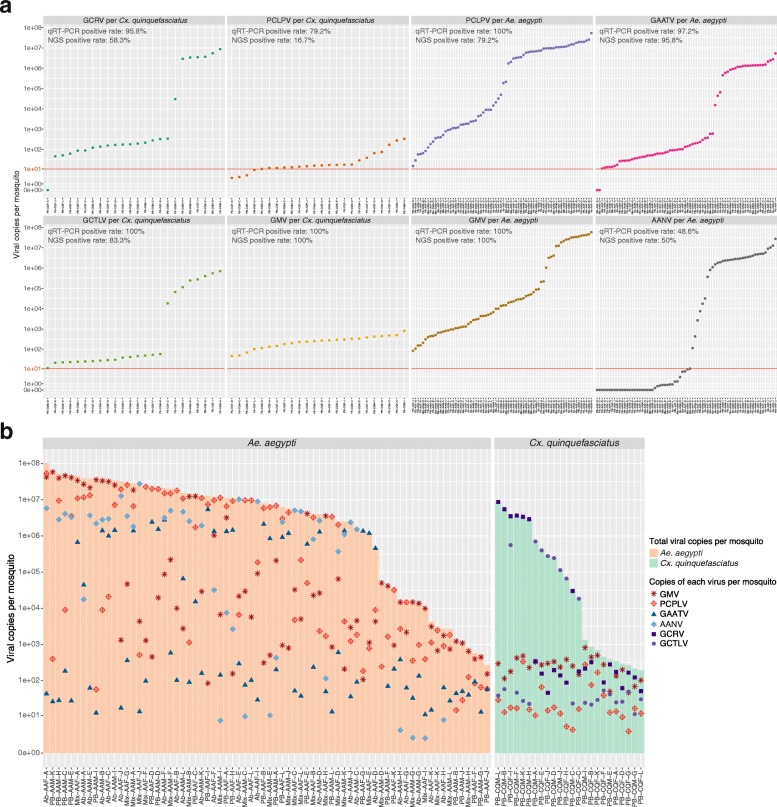
Fig. 6.
Quantification of GMV, PCPLV, AANV, GAATV, GCLTV, and GCRV in mosquito populations. a Copy number of each screened virus in individual Aedes aegypti or Culex quinquefasciatus. Y-axis is in log scale. The red lines indicate the ten copies, which was used as threshold to calculate the positive rate. The NGS positive rates are calculated from the reads abundance, using one read as threshold. b Total viral genome copies in each individual mosquito. The light orange and green bars indicate the total viral genome copies per individual of Aedes aegypti and Culex quinquefasciatus, respectively. Six different symbols with difference colors indicate the genome copies of each detected viruses

