
Figure 3. Data Distribution and Change in Total Bone Mineral Density (BMD) and Failure Load During 3 Years of Vitamin D Supplementation.
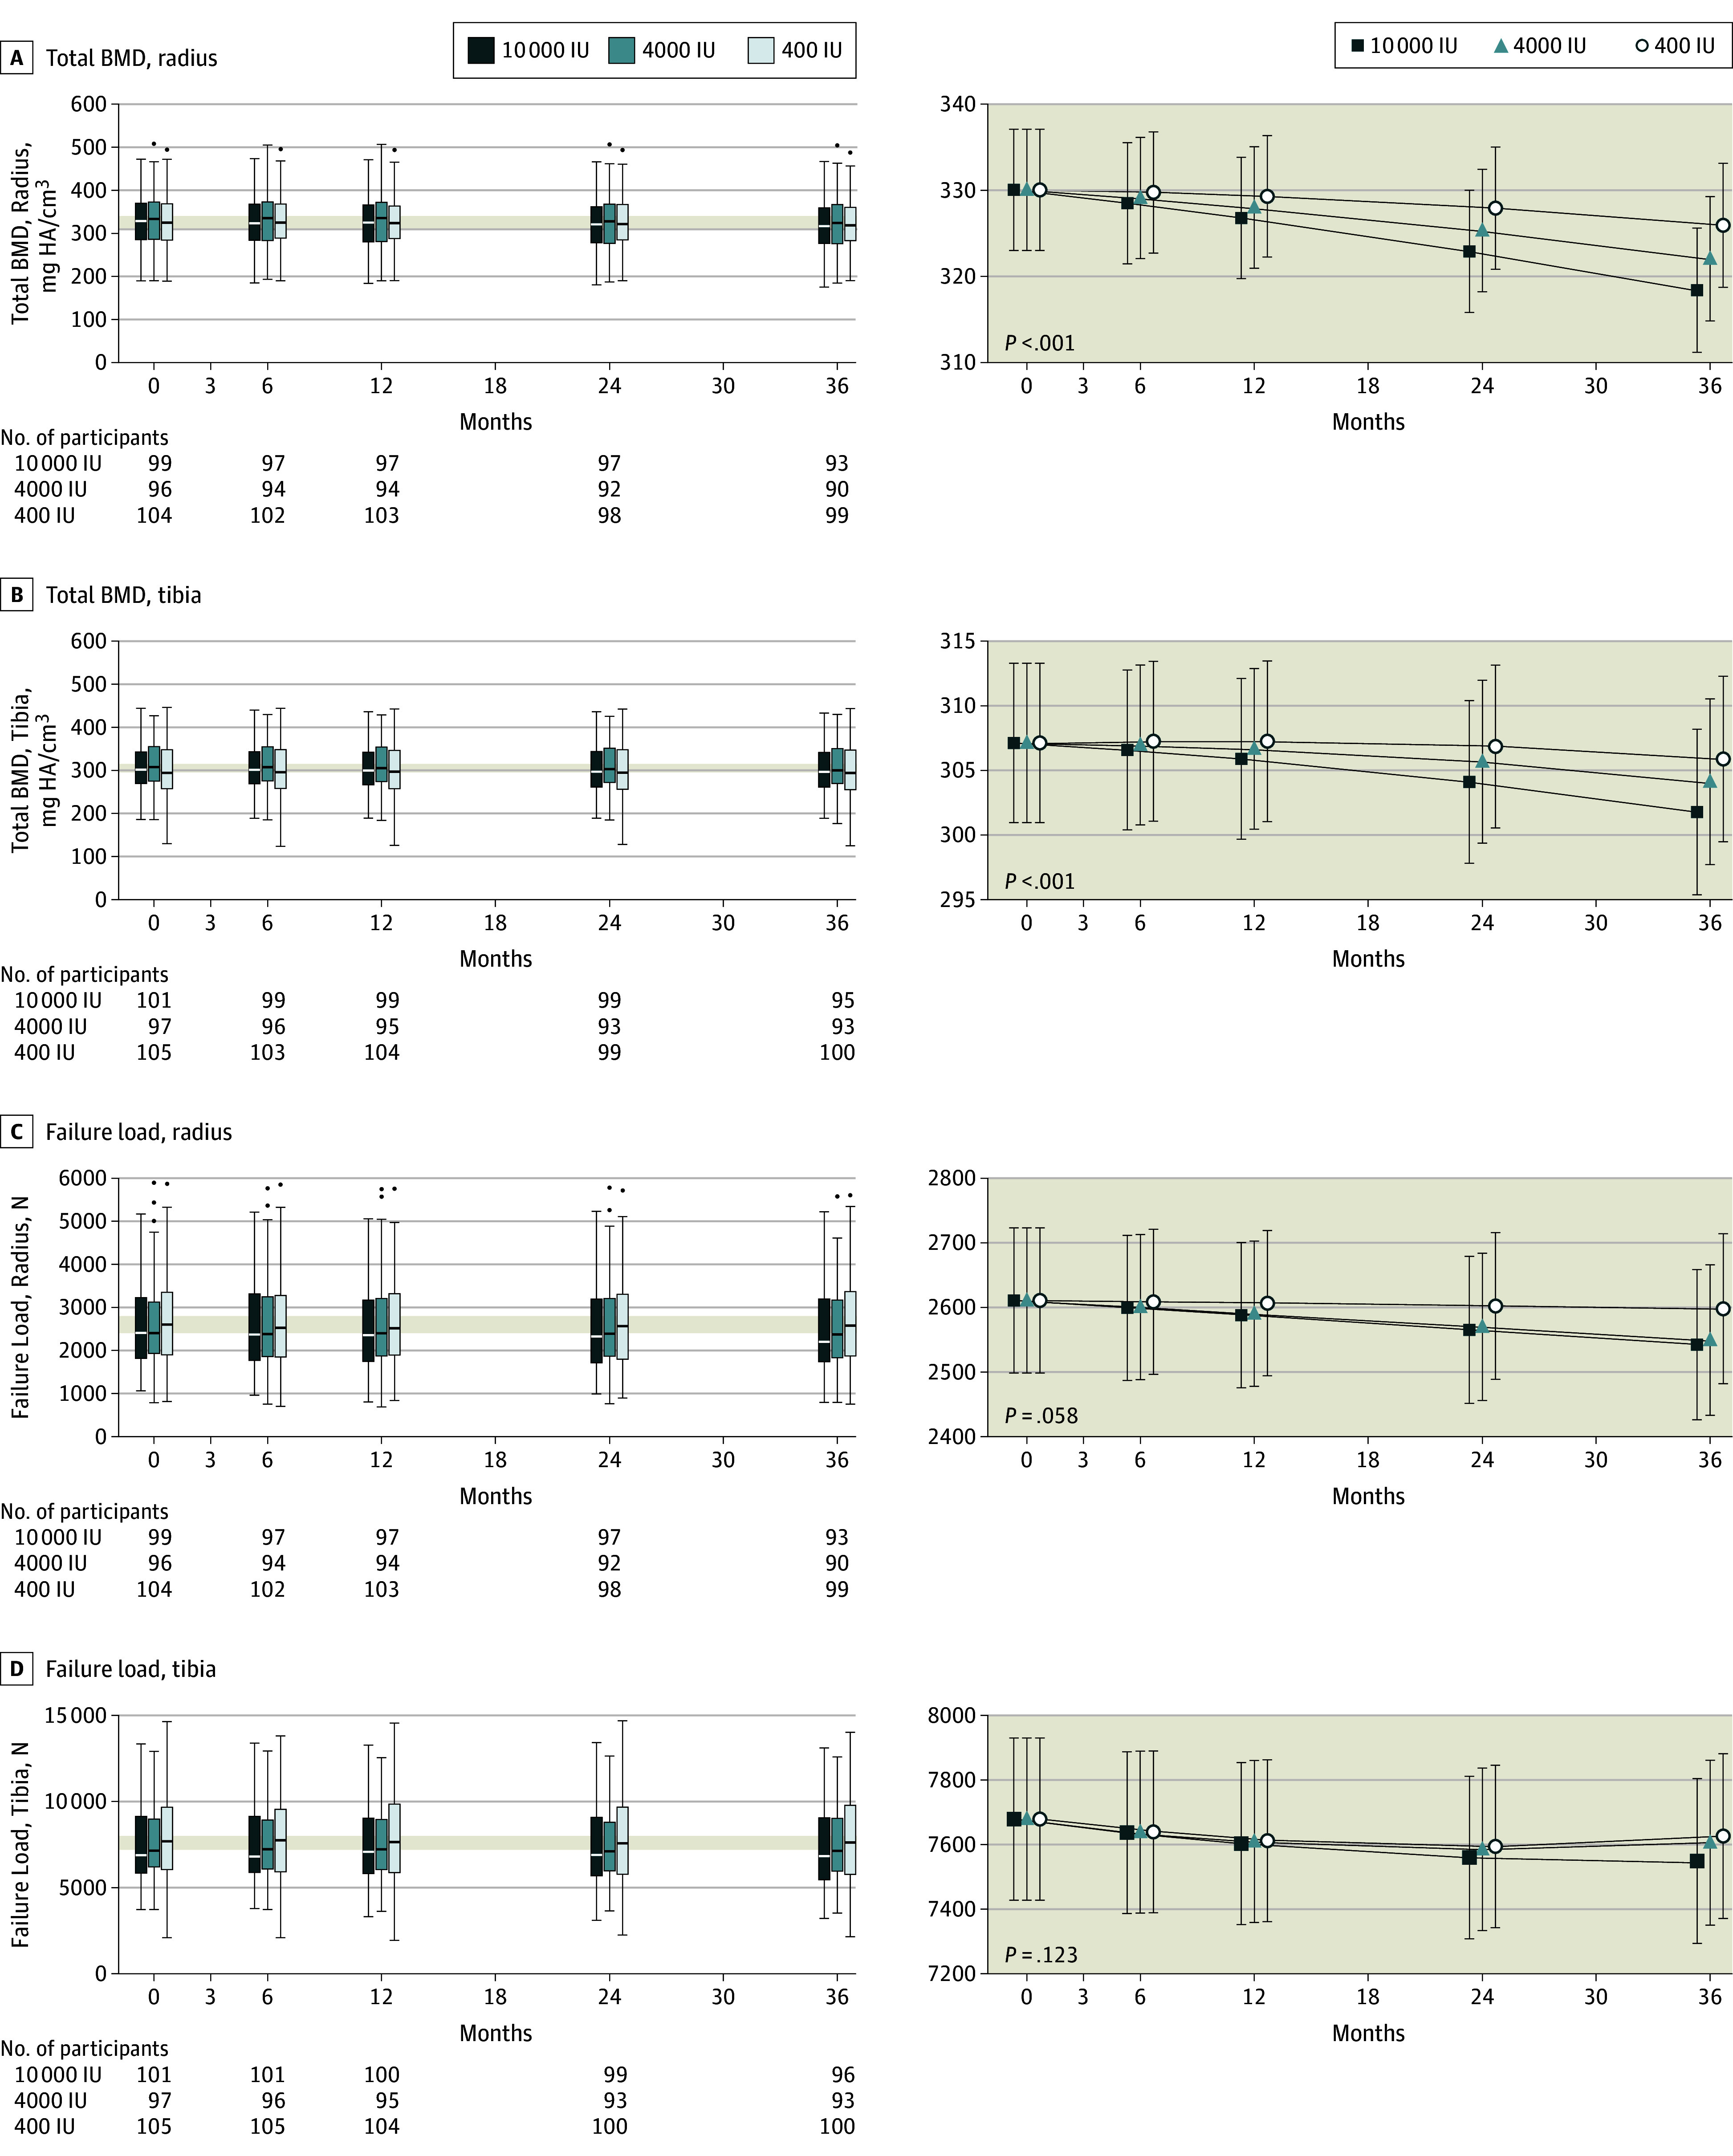
The horizontal line in the middle of each box (left column) indicates the median, the top and bottom borders of the box mark the 75th and 25th percentiles, the whiskers above and bolow the box indicate the 90th and 10th percentiles, and the points beyond the whiskers are outliers beyond the 90th or 10th percentiles. The modeled data (right column) show the mean 95% CIs for the predicted values using the random-effects model. P values indicate the group × time interaction effect.