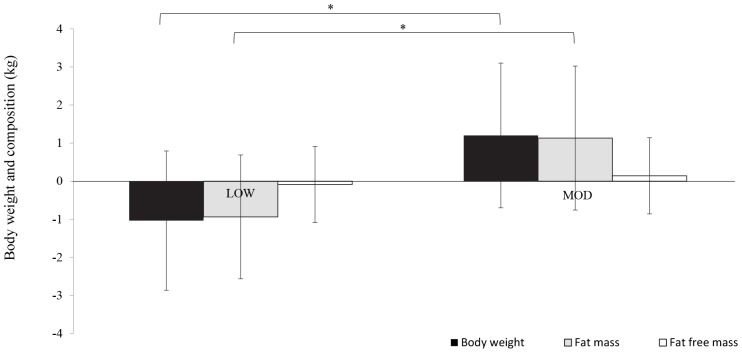
FIGURE 3.
Changes in body weight and composition during the exercise intervention performed at LOW (n = 11) and MOD (n = 8). Variables were expressed as change scores. LOW group: Body weight = –1.0 ± 1.8; Fat mass = –0.9 ± 1.6; Fat-free mass = –0.1 ± 1.7. MOD group: Body weight = 1.2 ± 1.9; FM = 1.1 ± 1.9; Fat-free mass = 0.1 ± 2.7. ∗, Indicates a significant main effect of group.

