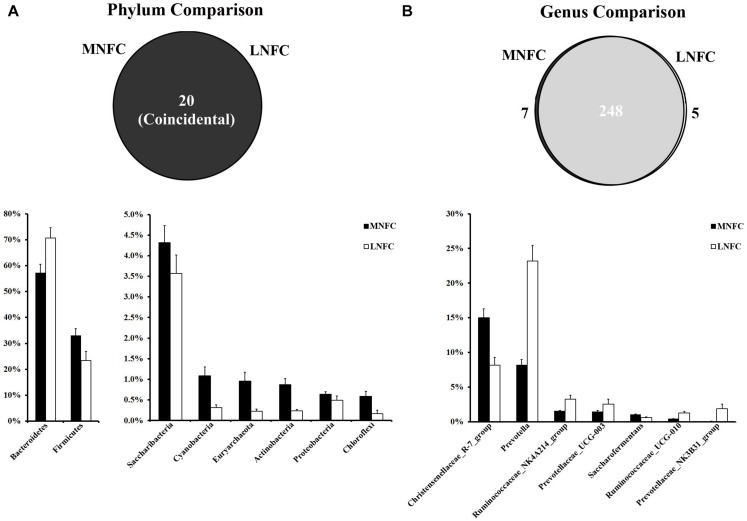
FIGURE 2.
(A) Phylum-level comparison of bacterial OTUs between the MNFC group and the LNFC group. (B) Genus-level comparison of bacterial OTUs between the MNFC group and the LNFC group. Only the Phyla and Genera whose relative abundance was more than 1% in at least one of the samples are shown in the figure. MNFC (28% NFC):, LNFC (14% NFC).

