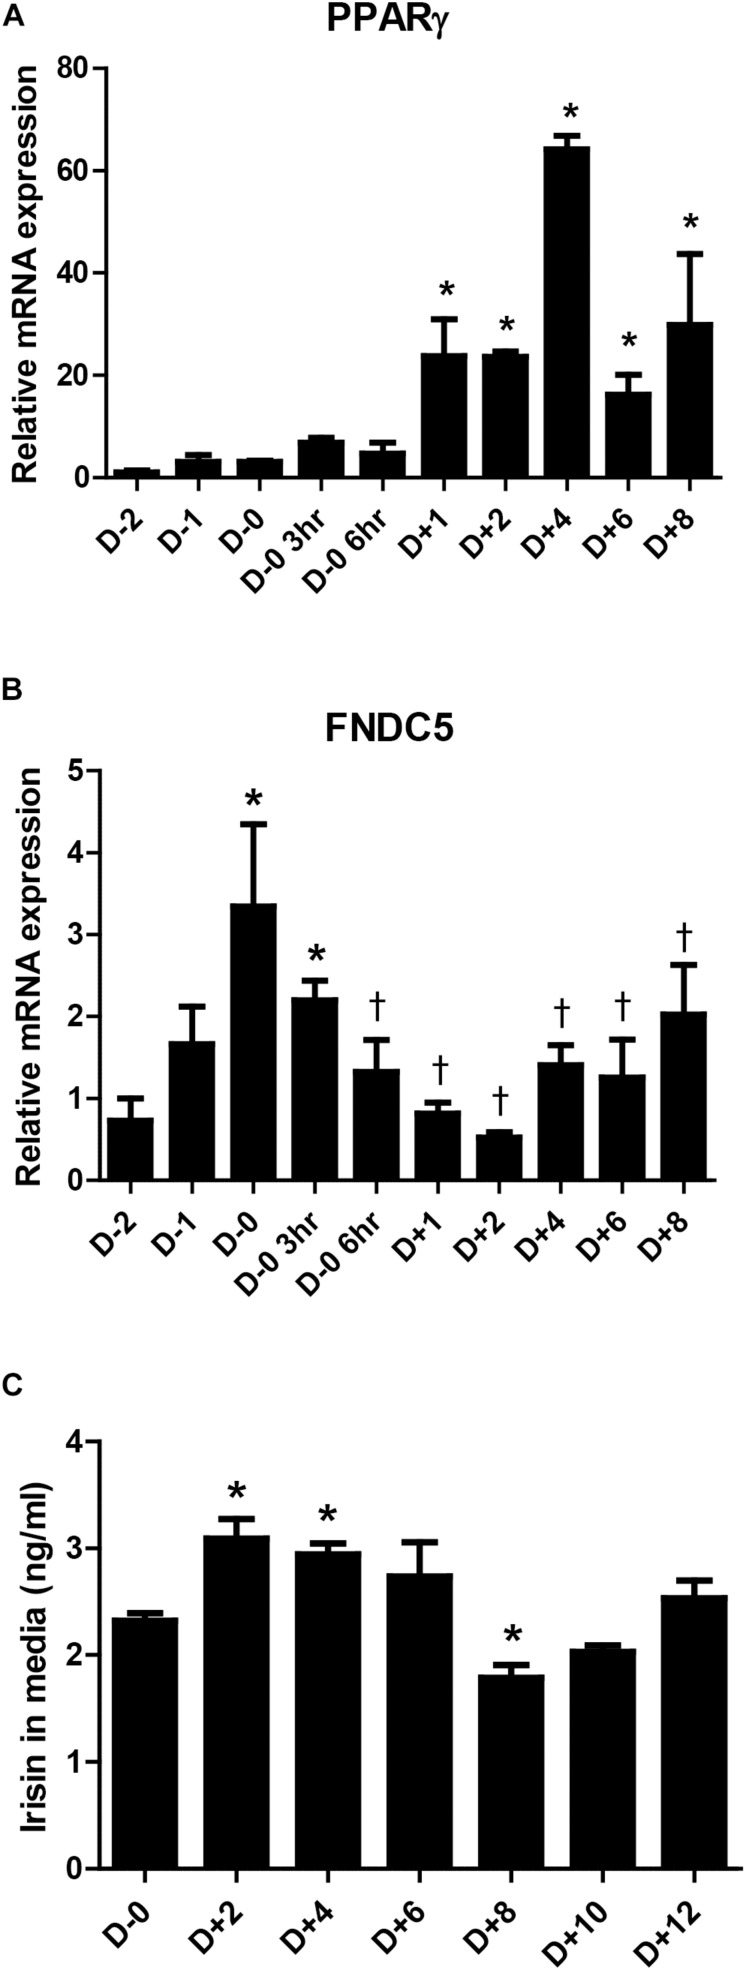
FIGURE 1.
Irisin gene expression and secretion during 3T3-L1 adipogenesis. (A,B) Gene expressions of PPARγ and FNDC5 were examined by real-time PCR during day D–2 to D+8 of adipogenesis. Quantifications were normalized to 18S in each reaction. ∗P < 0.05 compared with D–2, †P < 0.05 compared with D–0. (C) Irisin secretion in media during adipogenesis was analyzed by ELISA. ∗P < 0.05 compared with D–0.

