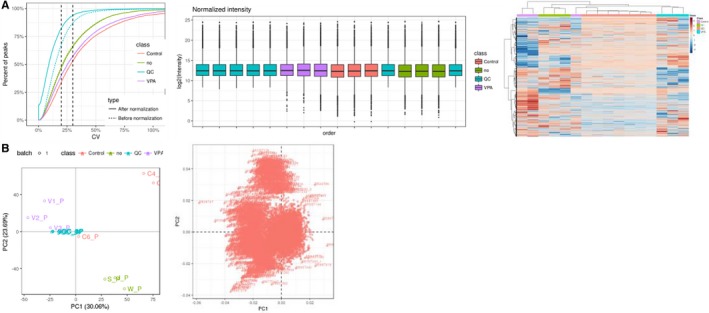
Figure 3.

Validating data of valproic acid (VPA)‐treated epileptic patients. As shown in CV, lipid intensity distribution maps and heatmap, these metabolite molecules showed high repeatability of the samples tested (A). As revealed in principal components analysis score chart, the VPA samples exhibited dot‐based distribution trend and significant diversity of lipids (B)
