Figure 4.

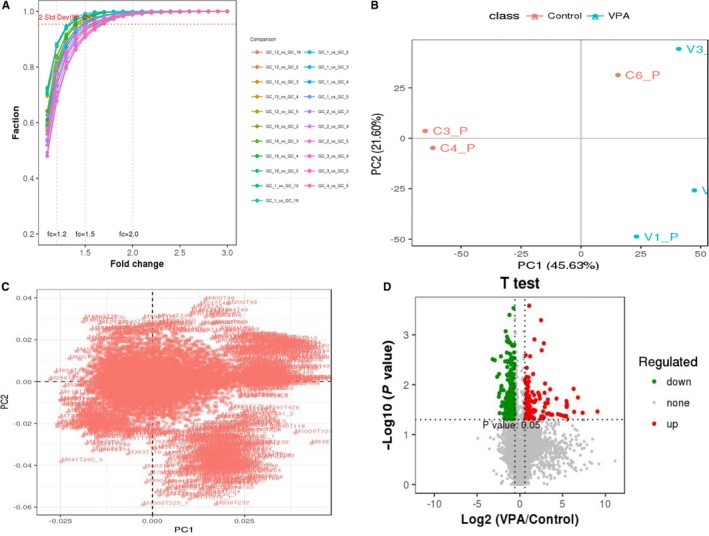
Differential expressed lipid molecules of valproic acid (VPA)‐treated epileptic patients. In ratio evaluation, less experimental errors in fold‐change of lipid percentage in all groups were observed (A). In principal components analysis (PCA), the trend of separation of VPA‐treated samples showed minor abnormal points and inconspicuous variability from the raw data (B). As shown in PCA scatter load diagram, the differential expressed lipids of VPA‐treated samples resulted in higher agminated class in comparison with those in controls (C). Followed by univariate analysis of fold‐change and p statistical test to obtain differential expressed lipids, 133 metabolites were significantly up‐regulated, while 250 molecules were down‐regulated (D)
