
Figure 8.
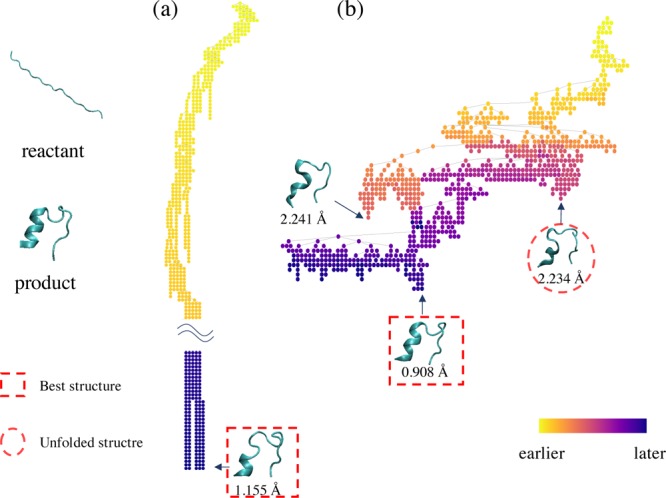
Search tree examples of (a) PaCS-MD and (b) TS-MD in the Trp-cage folding (orange and green trials in Figure 7). The color of each node indicates the order in which it is added to the tree. The intermediate structures at some nodes are also illustrated with the RMSD values from the product. The structures in the red dotted square are those having the minimum RMSD in each trial, and the structure in the red dotted circle is a misfolded structure.