
Figure 4.
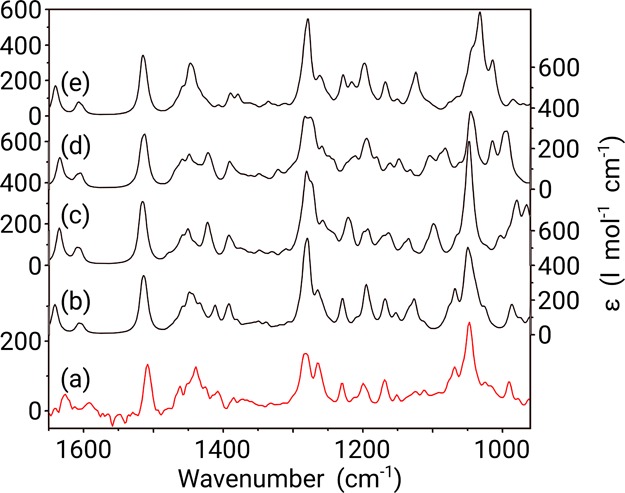
Comparison between the experimental IR spectrum (measured in CDCl3) (a) of galantamine and Boltzmann weighted calculated IR spectra of the 4aS,6R,8aS (b), 4aS,6R,8aR (c), 4aR,6R,8aS (d), and 4aR,6R,8aR (e) configurations of the molecule. Y-axis labels are placed alternating left/right to avoid congestion.