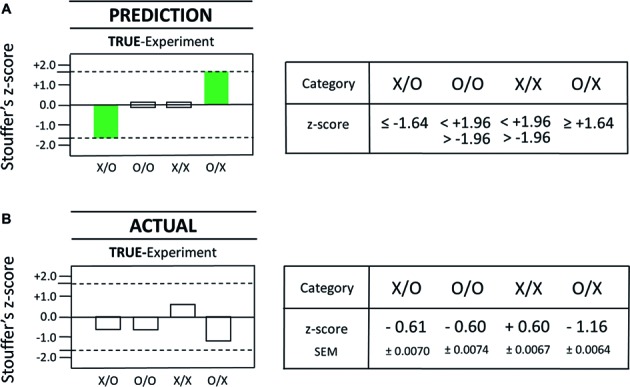
Figure 4.

Comparison of the actual results from the true-experiment with the pre-specified outcome predictions for the true-experiment. The statistical prediction for test categories X/O, O/O, X/X, and O/X is displayed as a graphical (left) and a numerical (right) representation in (A). The actual statistical results that were obtained with the true-experiment are displayed as graphical (left) and numerical (right) representations in (B). Specifically, the results of the commissioned replication study are shown for the four different AMP-based test categories in the true-experiment (with test subjects) as described by Stouffer’s z-scores as in the original Radin DS-experiment (Radin et al., 2012). In the present case, each Stouffer z-score summarizes 1,250 z-scores calculated for each test pair which comprised a given test category. The dashed lines represent the magnitude of the z-score at ±1.64 which is the cutoff for statistical significance (one-tailed). Since this analysis was built upon a nonparametric bootstrap method involving a 300-loop random permutation process, the outcome of the pre-specified statistical analysis will vary slightly each time it is conducted. In order to generate a reliable value, we performed 100 repetitions of the pre-specified analysis and calculated means and standard errors of these means (SEM) for each category. The number of individual test trials is identical for each test category, i.e., N = 1,250 for X/O, O/O, X/X, and O/X, yielding a total of 5,000 test trials for the true-experiment.
