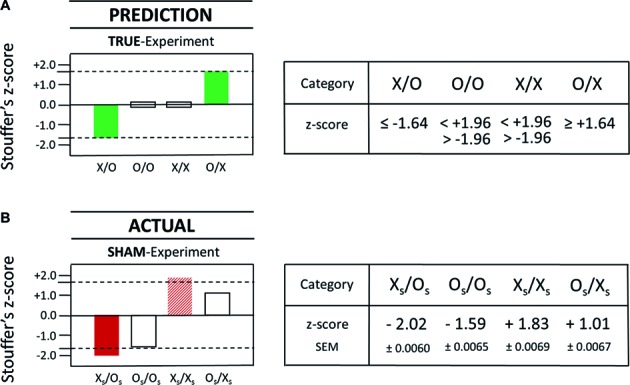
Figure 5.

Comparison of the actual results from the sham-experiment with the pre-specified outcome predictions for the true-experiment. The statistical prediction for test categories X/O, O/O, X/X, and O/X is displayed as a graphical (left) and a numerical (right) representation in (A). The actual statistical results that were obtained with the sham-experiment are displayed as graphical (left) and numerical (right) representations in (B). Specifically, the results of the commissioned replication study are shown for the four tested null hypotheses, i.e., H0-sham-XS/OS, H0-sham-OS/OS, H0-sham-XS/XS, and H0-sham-OS/XS (compare Table 1). Again, as was already described in Figure 4, each Stouffer z-score summarizes 1,250 z-scores calculated for each test pair which comprised a given test category, and the dashed lines represent the z-score magnitude at ±1.64, which is the cutoff for statistical significance (one-tailed). As before (see Figure 4B), the total number of dedicated test trials is identical for each test category, i.e., N = 1,250 for XS/OS, OS/OS, XS/XS, and OS/XS, yielding a total of 5,000 test trials for the complete sham-experiment. Importantly, none of the test trials used in the testing of one null hypothesis (e.g., H0-sham-XS/OS) was used again for the testing of another null hypothesis (e.g., H0-sham-XS/XS). Therefore, as was explained in Section “Statistical Interpretation of True- and Sham-Experiments,” a statistical correction for multiple testing is not applicable in the strictly predictive AMP-based research design.
