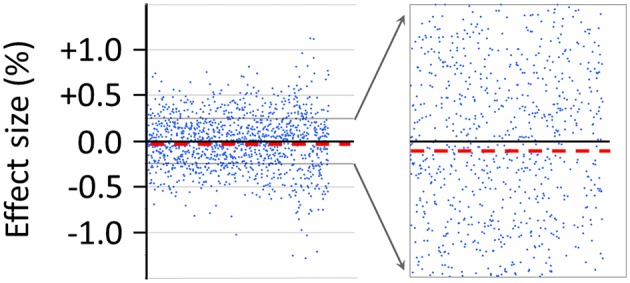
Figure 6.

Effect size in percent of the false-positive observer effect as detected with the sham-experimental test category XS/OS (compare Figure 5). The effect size marked by each dot in the graphs represents a measure of the difference between the means of two consecutive 30-s epochs (i.e., XS and OS), as calculated by the pre-programmed Matlab script, and as expressed as the percentage of the mean of the first 30-s epoch (XS). In all, N = 1,250 ratio values are shown for the sham-experiment XS/OS to the left of the figure. These data represent a total of about 20 h of recordings for the sham-experiment XS/OS alone, which were obtained over a time course of several months using the AMP (see Section “Insertion of the AMP Into the Radin DS-Experiment”). The progression in time of collected recordings is from left to right. To the right of the figure is illustrated the magnification – in the range from ±0.25% – of the distribution of the ratio values (%). The dashed line in the figure marks the mean effect size (−0.0159%), which is a measure of the amount of SME in the form of class-A error as detected by the AMP-based XS/OS-test category. For the calculation of the effect size, see also the main text.
