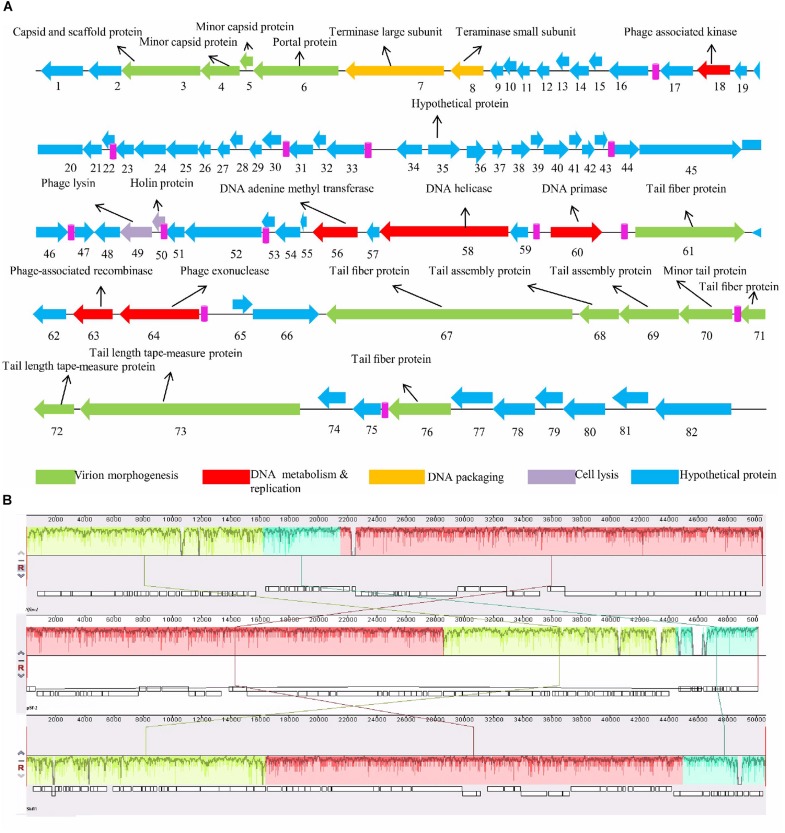
FIGURE 5.
Genome organization of Sfin-1. (A) The Sfin-1 genome map was schematically presented. The predicted CDSs are indicated as arrows, the orientation of which shows the transcription. With different colors predicted molecular function for CDS of virion morphogenesis (green arrows), DNA metabolism and replication (red arrows), DNA packaging (yellow arrows), cell lysis (violet arrows), hypothetical proteins (blue arrows), putative promoters (pink) are denoted. (B) Comparative genomic maps of phage Sfin-1, pSf-2, Shfl1 was constructed using the Mauve progressive alignments to determine conserved sequence regions. This alignment resulted into two large synteny locally collinear blocks (LCBs) with 28,894 bp (red) and 16,173 bp (green), one small LCB with 5,334 bp (sky), indicating DNA regions which are homologous among the genomes. Graphs inside the blocks show high similarity between the genomes. There are some non-identical genome regions which are denoted with white color inside the blocks. Although there seems to be genomic rearrangement, the block sequence remains the same across the genomes of all phages.

