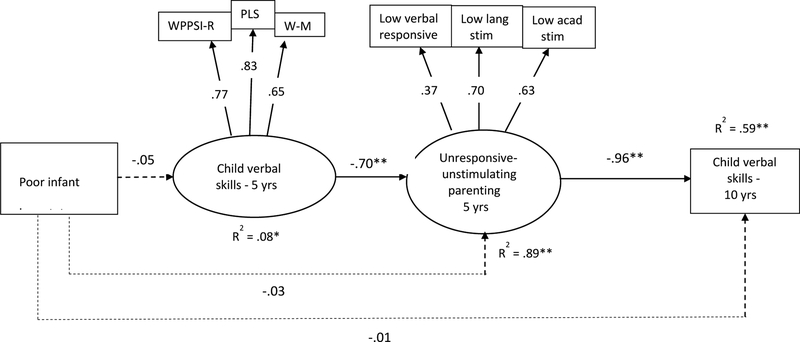
Figure 3.
Model of alternate ordering of variables. Poor iron status coded to reflect increasing deficiency severity: 0 = iron sufficient, 1 = iron deficient, 2 = iron-deficient anemic (N = 875). Standardized coefficients are shown. All direct and indirect paths were tested. Dotted lines represent nonsignificant paths. Model fit: χ2 (67) = 343.89, CFI = .848, RMSEA = .069, SRMR = .037. WPPSI-R: Wechsler Preschool and Primary Scale of Intelligence – revised version. PLS: Preschool Language Scales. W-M: Woodcock-Muñoz Language Survey. *p < .01. **p < .001.

