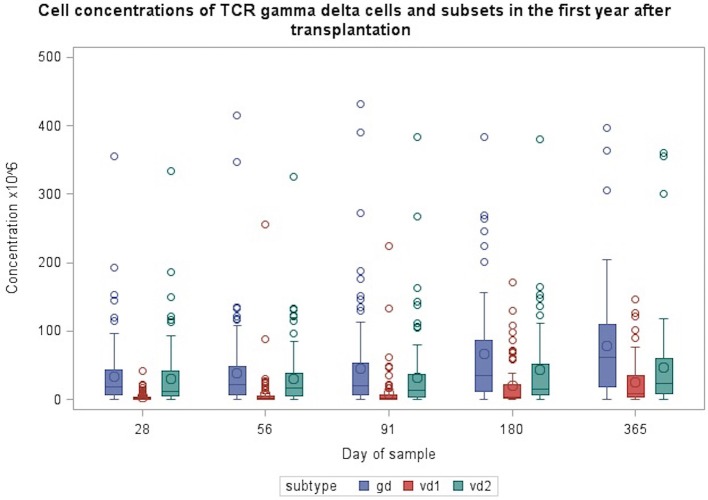
Figure 1.
Concentrations of TCR γδ cells and Vδ1 and Vδ2 subsets during the first year after transplantation. Patient numbers day 28 n = 106, day 56 n = 104, day 91 n = 99, day 180 n = 86, day 365 n = 66 (values from one patient with day 180 TCR γδ cell concentrations of 632 mio/L and Vδ2 concentration of 570 mio/L are not included in the figure).

