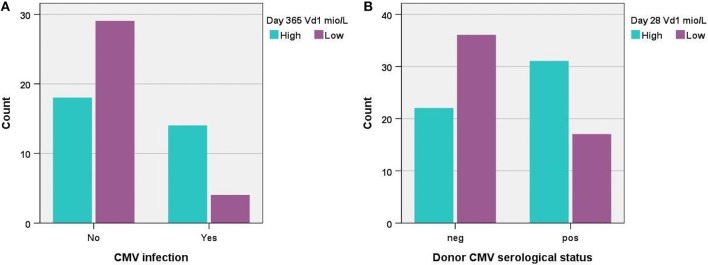
Figure 7.
(A) Distribution of patients with high vs. low concentrations (median 7.9 × 10⁶/L) of TCR Vδ1 cells 1 year post-transplant according to CMV infection, p = 0.004, n = 66, and (B) distribution of patients with high vs. low concentrations (median 1.5 × 10⁶/L) of TCR Vδ1 cells 28 days post-transplant according to donor serological CMV status, p = 0.006, n = 106.

