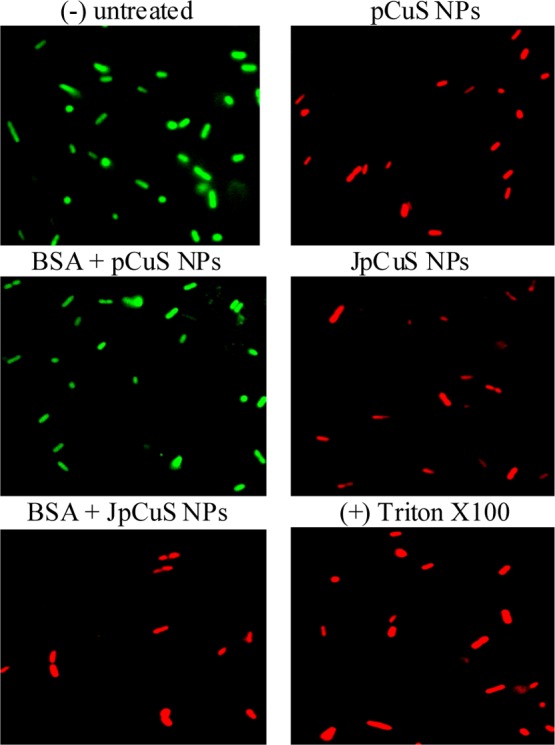
Figure 5.

Representative membrane integrity assay. E. coli was treated with NPs, followed by staining with AO/PI and imaged in fluorescence microscopy. Untreated cells serve as negative (−) control and cells treated with Triton X100 served as positive (+) control. Red fluorescence indicates that cells have compromised membranes. BSA—50 μM; jacalin—50 μM. Magnification—100×.
