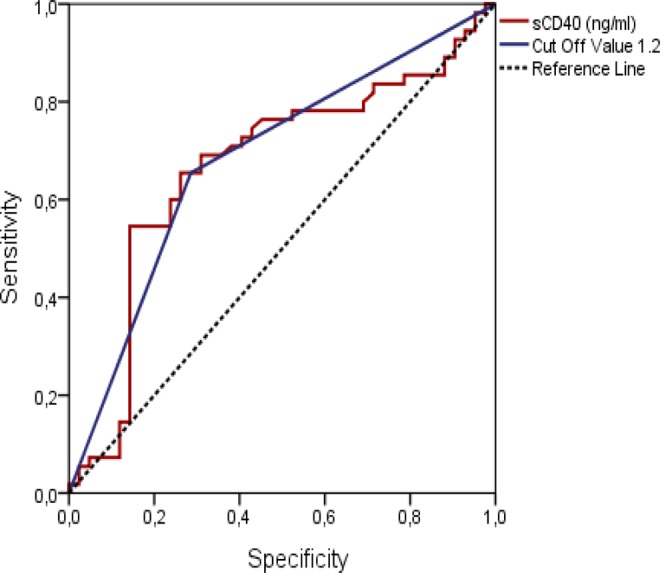
Figure 3.

The ROC curve for soluble CD40 ligand revealed that cutoff values over 1.2 ng/L were correlated with coronary artery ectasia (75% sensitivity, 65.5% specificity, positive predictive value: 65.5%, and negative predictive value: 71.4%; area under the curve: 0.684, 95% CI: 0.576-0.792, P < .002). 95% CI indicates 95% confidence interval; ROC, receiver operating characteristic.
